EOPEN User Guide
Abstract
This document is the EOPEN User Guide. Its purpose is to describe the features and the capabilities supported by the EOPEN User Portal. The content of this document is part of the result of the work performed on T6.2 “EOPEN System Integration” and T6.4 “Interactive real‑time user‑friendly visualisation”.
Version |
Date |
Reason |
Revised by |
Approved by |
|---|---|---|---|---|
3/5-Aug-2020 |
Internal review |
Gilles Lavaux, Valentina Faccin, Gabriella Scarpino (Serco) |
||
1.0 |
19-Aug-2020 |
First release |
Authors |
Leslie Gale |
Organisation |
Name |
Contact |
|---|---|---|
SpaceApps |
Bernard Valentin |
|
SpaceApps |
Hakim Boulahya |
|
SpaceApps |
Leslie Gale |
|
CERTH |
Stelios Andreadis |
This deliverable presents the final result of the work performed on the “interactive real‑time user‑friendly visualisations” task. This result corresponds to the software integrated in the third and final release of the EOPEN Platform.
The objective of the EOPEN User Portal is to provide to end‑users means to search for and visualise the data available in the EOPEN Platform in the most appropriate manner. The available data may be “proxied” (thus fetched in real‑time from external sources such as FMI), may have been manually or automatically ingested as it is the case of weather forecast and tweets data, or may have been generated within the platform as it is the case of water body masks and rice paddy fields maps.
The EOPEN User Portal is meant to be as generic as possible. It integrates a series of System Dashboards that are pre‑configured to display different types of data of interest whatever the use case. It also provides a series of graphical components that may be used to create custom dashboards.
This document describes how users may use the EOPEN User Portal to find and visualise data but also how to create new dashboards to better meet their needs.
How to access the EOPEN Platform (User Portal)
The EOPEN User Portal described in this document is available at the following address:
https://eopen.spaceapplications.com
AOI |
Area of Interest |
API |
Application Programming Interface |
ASB |
Automated Service Builder |
EO |
Earth Observation |
EOPEN |
opEn interOperable Platform for unified access and analysis of Earth observatioN data |
ESA |
European Space Agency |
FSM |
Full Strip-Map |
FTP |
File Transfer Protocol |
GDAL |
Geospatial Data Abstraction Library |
GPT |
Graph Processing Tool |
GUI |
Graphical User Interface |
HTTP |
Hyper-Text Transfer Protocol |
JSON |
JavaScript Object Notation |
OGC |
Open Geospatial Consortium |
S1, S2, S3 |
Sentinel‑1, Sentinel‑2, Sentinel‑3 |
SNAP |
Sentinel Application Platform |
SpaceApps |
Space Applications Services |
VM |
Virtual Machine |
WFS |
Web Feature Service |
WMS |
Web Map Service |
WPS |
Web Processing Service |
Introduction
This document describes the features and capabilities implemented in the EOPEN User Portal integrated in the final release of the EOPEN Platform.
General Concepts
The EOPEN User Portal makes use of a few general concepts to refer to its building parts.
First of all, there is the Portal itself. This refers to the whole Web application. All the pages, menus, graphical components visible in the Web browser are considered as building blocks of the Web portal.
Besides a couple of special pages (including the “Home” page and the “About” page), the pages that are used to display data available in the EOPEN Platform are called Dashboards. Dashboards contain one or more graphical (web) Components which are used to search and visualise the data. Different filters and viewers are available to support the different types of data present in the platform.
The next chapter describes in details the available dashboards and components and explains how new custom dashboards can be created by selecting and arranging components as needed.
User Accounts / Authentication
The EOPEN Web Portal is accessible without restrictions. The displayed information and the dashboards created by the users are publicly accessible.
This is a temporary situation. The implementation roadmap foresees a merge of the EOPEN Web Portal with the Developer Portal. At that time the role-based access control already used to restrict access to the developers will also be applied to the end‑users who only need to access the Web Portal described in this document.
Configuration
As users are not yet individually recognised, the changes applied to the portal pages are shared and customisable by anyone.
The EOPEN User Portal
This chapter describes the user interface of the EOPEN User Portal. Next section gives an overview of the available pages and the main navigation links.
The remaining of the chapter describes the pre‑defined pages, the available components and the controls for creating and customising new pages.
Site Map and Page Layout
Figure 1, below, shows the structure of the EOPEN User Portal. Except the banner panel shown on the left, each box represents a Web page and the arrows show the navigation between the pages.
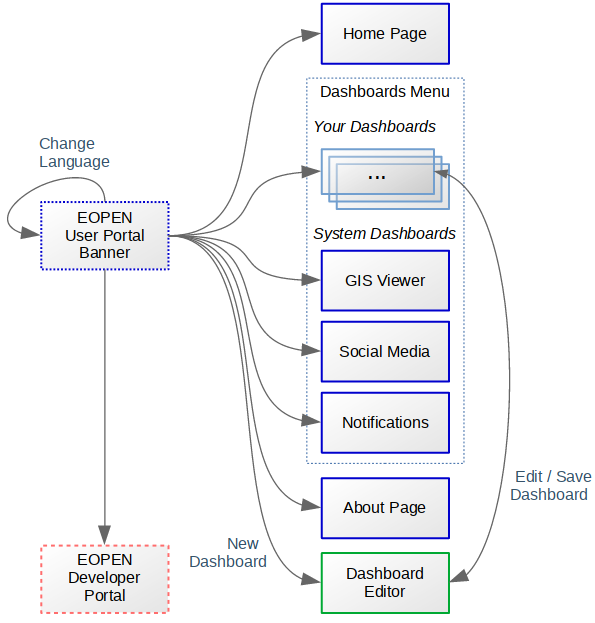
Figure 1 EOPEN User Portal Site Map
The EOPEN User Portal Home Page (https://eopen.spaceapplications.com) welcomes the visitor. The page body informs about the EOPEN project and provides a link to the Developer Portal, described in a separate document.
The page banner, included in all pages, contains the following elements:
The EOPEN logo that leads to the Home Page.
A Dashboards menu which lists the available dashboards grouped in two categories:
“Your dashboards” contains the dashboards created and configured by the users. In a fresh installation this category is empty.
Important: As the dashboards are currently shared among the users, pay attention not to modify a dashboard without the consent of its creator, if known.
“System dashboards” lists the built‑in dashboards. These are pre‑defined in the EOPEN Portal and are not editable.
The GIS Viewer dashboard allows searching and visualising geospatial
data on backgound maps. The GIS Viewer dashboard is described in
GIS Viewer.
The Social Media dashboard allows searching, inspecting and
visualising collected Tweets on an interactive map. This dashboard is
described in details in Social Media (Tweets) Viewer.
The Notifications dashboard displays the messages issued by the
applications running in the EOPEN Platform through Mattermost channels.
The Notifications and Instant Messaging dashboard is described in
Notifications and Instant Messaging.
A New dashboard button that allows creating custom dashboards, as described in
User Authentication.A Developer Portal » button that leads to the EOPEN Developer Portal described in the dedicated EOPEN Developer Guide.
An Edit dashboard button is displayed on the right side and only when an editable Dashboard is selected. Click on this button to enter the dashboard editing mode, as described in
User AuthenticationA menu that allows selecting the display language. Supported languages are English (en), Italian (it), Finnish (fi) and Korean (ko, as shown on Figure 3).
A question mark icon leads to the About page. This page provides technical information about the portal including the list of the integrated third party data and software.

Figure 2 Home Page
The screenshot in Figure 3 shows how the Home page is displayed when the Korean language is selected.

Figure 3 Home Page (Korean Version)
System Dashboards
Pre‑defined pages already combine available components to provide general purpose features. These are introduced in the following sections.
GIS Viewer
The GIS Viewer page allows visualising the geo‑localised data available in the platform on interactive 2D maps and 3D globe. The page is accessed by clicking on the GIS Viewer entry in the Dashboards menu.
As may be seen on Figure 4, besides the banner at the top, the GIS Viewer occupies the entire page. The Viewer is implemented with the open‑source software OpenSphere whose technical information may be found at: https://opensphere.readthedocs.io/en/latest/. The tool includes embedded help information, accessible through the question mark button located in its upper‑right corner.
In this section we explain how data available in the EOPEN Platform may be selected and visualised on the map. The geo‑localised data is stored in a GeoServer instance pre‑configured in the viewer.
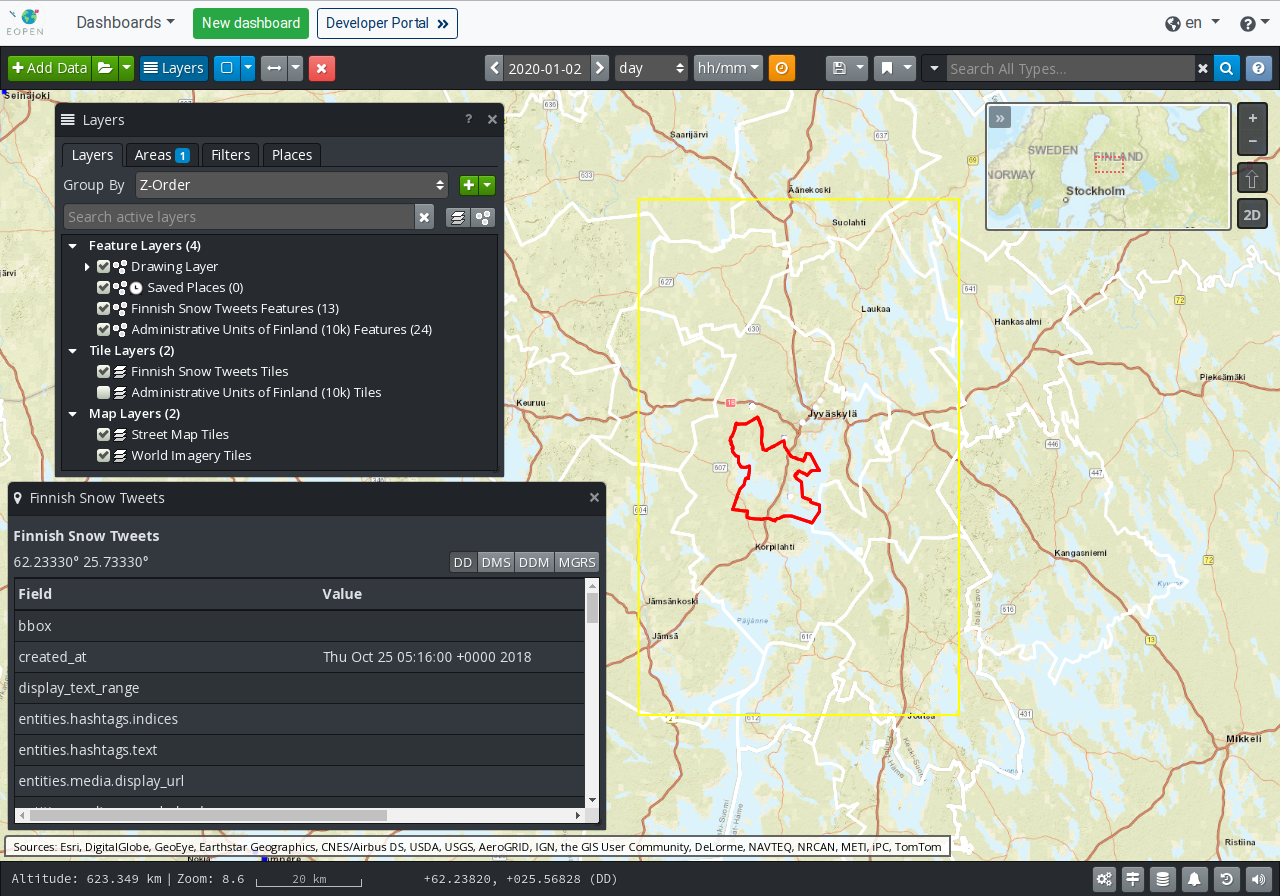
Figure 4 GIS Viewer
Proceed as follows to visualise data as layers on the map:
Click on the Add Data button located in the upper‑left corner of the viewer.
In the Add Data dialog box (Figure 6), identify and expand the “EOPEN GeoServer” source.
Toggle the switch next to the layers of interest. The changes are immediately applied. There no button to accept the changes. Click on the Close button when done.
If the Layers floating panel is not visible, click on the Layers button in the banner.
The Layers panel lists the selected Feature Layers, Tile (Raster) Layers and the (Base) Map Layers.
In order to focus the map on the data of a certain layer, select the layer in the list, right‑click on it to reveal a popup menu, then select the Go To entry in the menu. Figure 5 shows the map focusing on a water mask product.
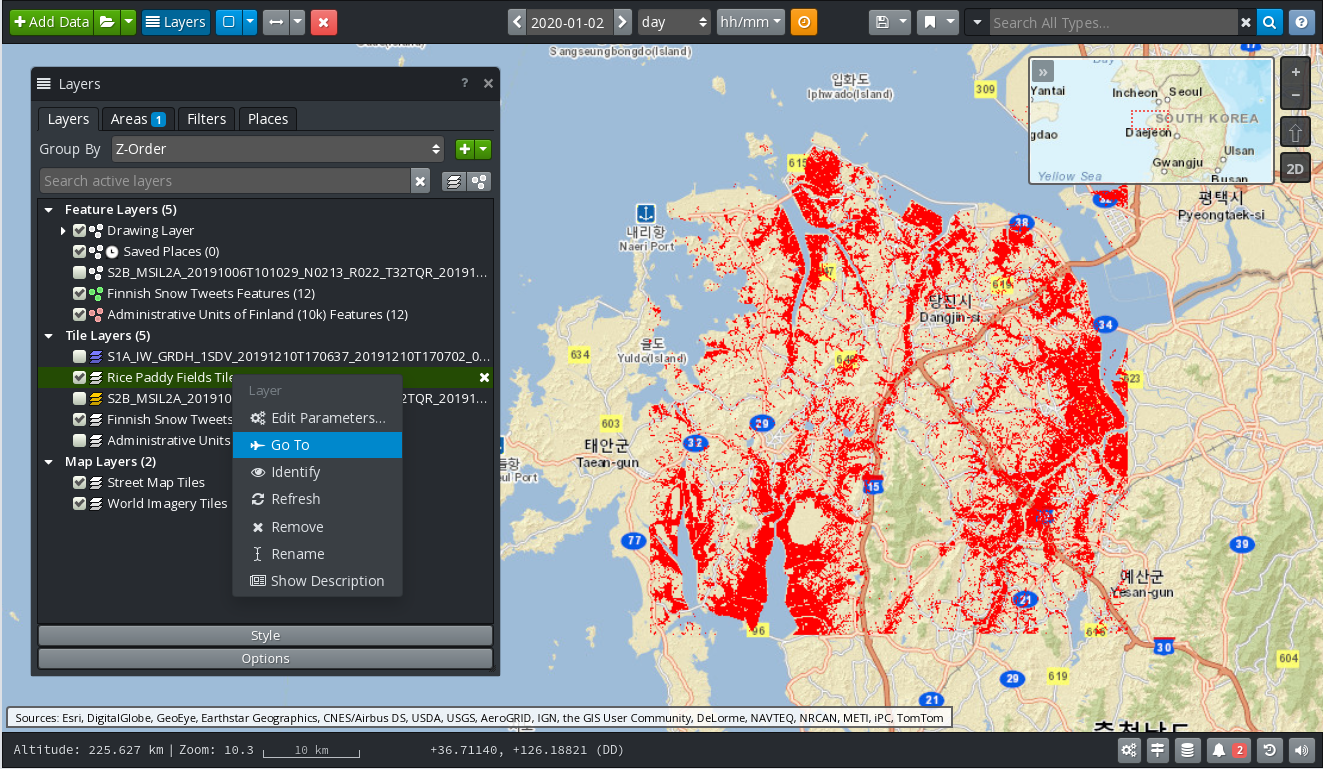
Figure 5 GIS Viewer: Go To Rice Paddy Mask Layer
Available Data
Geo‑localised data available in the EOPEN Platform include the data ingested and generated by the Pilot Use Cases. Examples are:
Water body masks (raster and vector) extracted from Sentinel‑1 and Sentinel‑2 scenes.
Rice paddy masks (raster, as shown on Figure 5)
Collected Tweets in different languages and matching each use case (vector/features)
Weather (temperature, wind, precipitation, …) forecast data (raster)
Administrative data from Finland (raster and vector)
From FMI ClimGrid:
Daily Snow Depth in Finland between 1961 and 2018, 10km resolution.
Daily Mean Temperature in Finland between 1961 and 2018, 10km resolution.
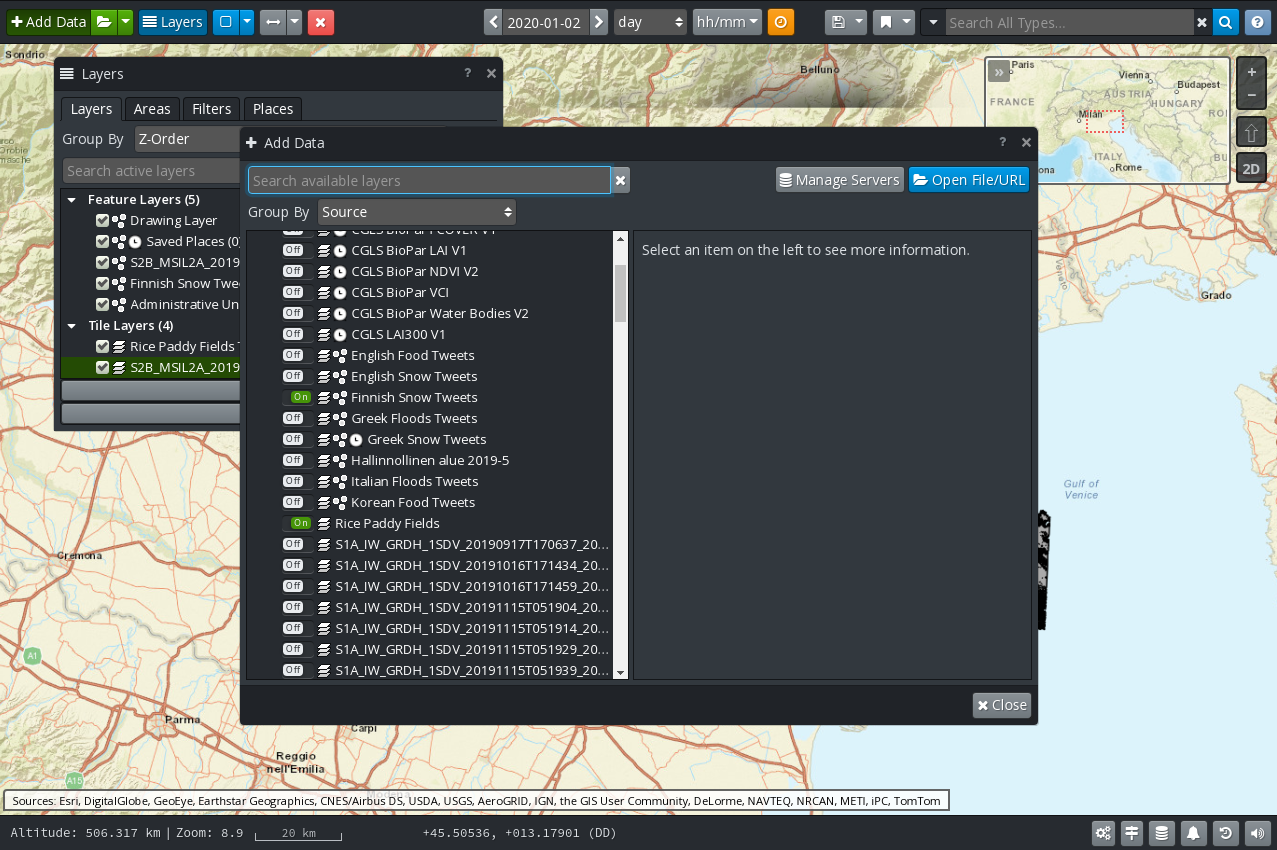
Figure 6 GIS Viewer: Add Data
Layers Panel
The Layers Panel contains 4 tabs:
Layers: Lists the pre‑configured and the selected layers, organised in three groups:
Feature Layers: Includes areas drawn on the map, and vector layers (i.e. served via OGC WFS)
Tile Layers: Includes the raster layers (i.e. served via OGC WMS and WMTS)
Map Layers: Includes the pre‑configured base maps: a Street Map and a World Map (satellite imagery) both served by ArcGIS Online.
The layers may be enabled and displayed using check-boxes and may be moved up and down with the mouse to control in which order they appear on the map.
At the bottom of the panel, an option area allows automatically refreshing the data at a regular interval.
Areas: Lists the areas drawn on the map and the closed polygon features converted into areas. Areas may be selected to filter the features to be displayed on the map. This is further explained below.
Filters This tab allows creating and managing advanced filters by combining layers, areas and feature properties.
Places: This tab allows creating and managing custom locations.
Layer Styling
When a layer is selected in the list several buttons appear at the bottom of the panel:
A Style button appears. Clicking on this button reveals controls for customising the appearance of the layer on the map. As can be seen on Figure 7, available controls include the opacity, brightness and contrast as well as the base colour. If a Feature Layer is selected, the display size may also be adjusted.
If a Feature Layer is selected a Label button is also available. This allows selecting which feature properties must be displayed on the map and how (size and color).
Controls under the Options button allow configuring how often the layer will auto‑refresh on the screen.
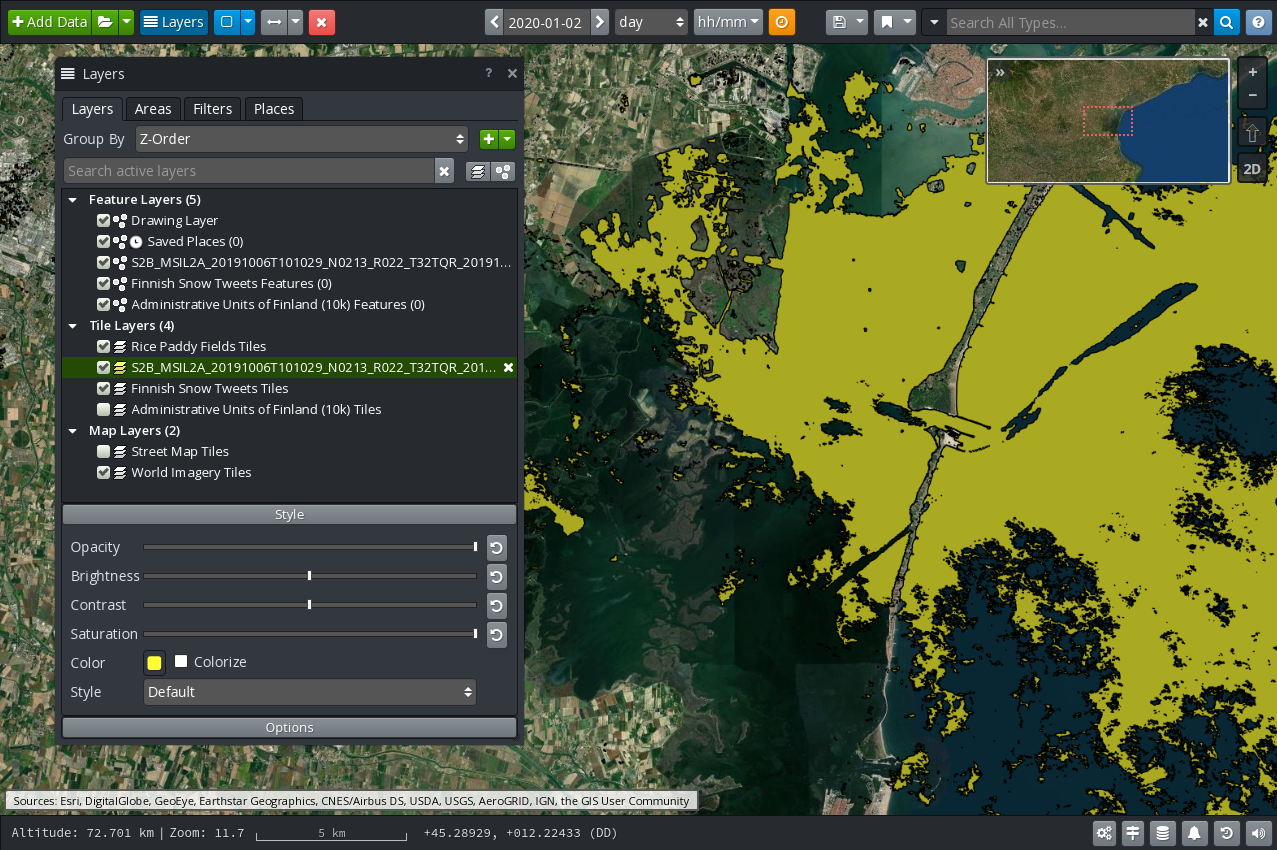
Figure 7 GIS Viewer: Styling a Layer
Features Filtering
As mentioned above, the features, including vector data, must be selected using custom areas.
In order to search for features located in a bounding box:
Select one or more feature layers from the EOPEN GeoServer.
Click on the blue button in the GIS Viewer banner that shows a rectangle. By default, the selection has the shape of a rectangle. Expand the menu associated to the button to select other shape types.
When the tool is enabled, use the mouse to select an area on the map. A context menu appears automatically. In this menu select the Load entry. The selected area is added in the list of areas in the Layers panel and the features located in the area are automatically queried from the server and displayed.
It is then possible to select individual features and visualise their properties.
If a feature is itself a closed polygon it can be used to define a new area. To do this, select the polygon, open its context menu (click on the right mouse button) and select the Add entry.
Custom areas are managed via the Areas tab in the Layers panel. In particular, areas may be renamed, imported and exported, enabled and disabled, etc.
Figure 4, above, shows an administrative region located in Finland (red polygon on the map), used as an area for filtering Tweets about snow in the Finnish language. One of these Tweets has been selected and its information displayed in the floating panel located in the bottom left of the screen.
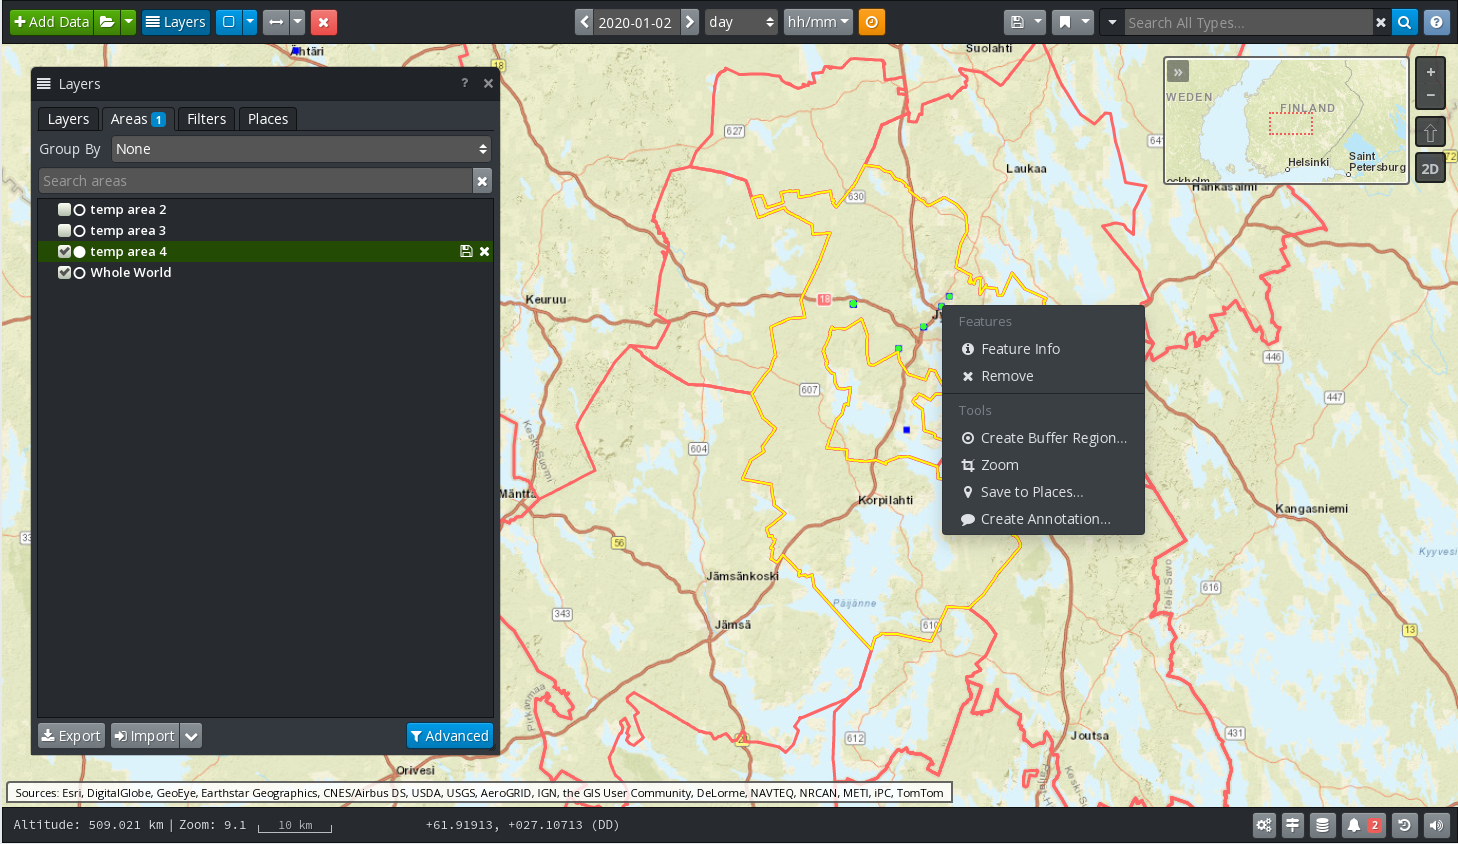
Figure 8 GIS Viewer: Feature Selection
This is only a short introduction to OpenSphere. Many more features may be discovered by using the tool directly.
EOPEN Extensions for OpenSphere
An extension has been developed that permits to trigger the execution of workflows in the EOPEN platform from within the GIS Viewer.
At the time of writing this document, the plugin supports two workflows:
The extraction of statistical information from FMI ClimGrid products
The extraction of timeseries from FMI ClimGrid products
To accomplish this, execute the following steps:
In the GIS Viewer, select an area of interest and give it a name. If you want to select or rename an AOI, check “Features Filtering” at the precedent item.
Select one or both of the FMI ClimGrid layers.
Right-click in the Layers panel and select either the Timeseries or the Statistics entry.
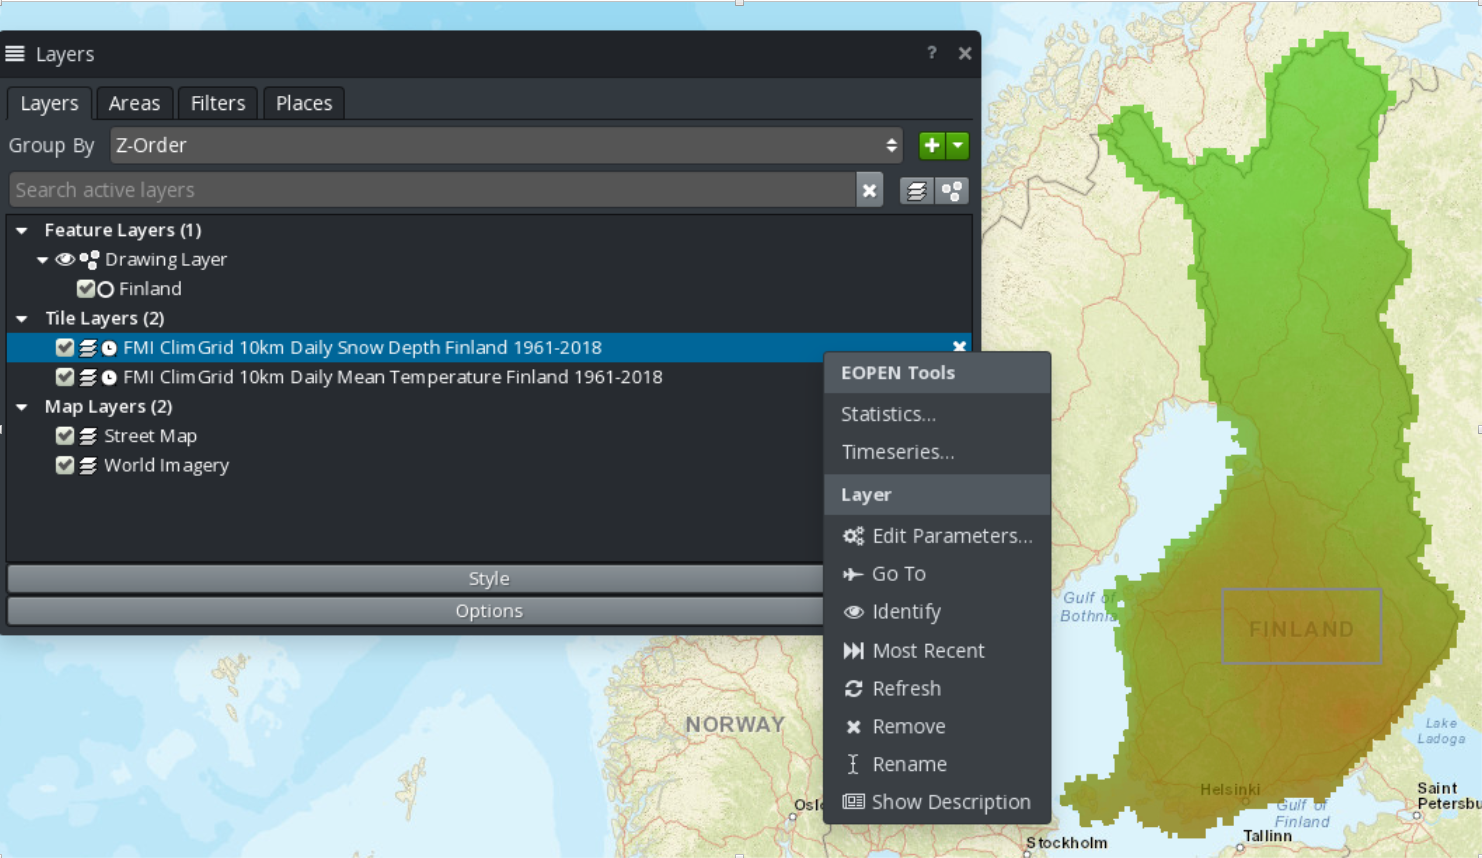
Figure 9 FMI ClimGrid Timeseries and Statistics: OpenSphere plugin
- The plugin displays a dialog box (Figure 10) that allows selecting the layer,
the area and a date range (or a single date for the Statistics execution). Click on the Execute button to trigger the execution of the corresponding workflow in the EOPEN Platform.
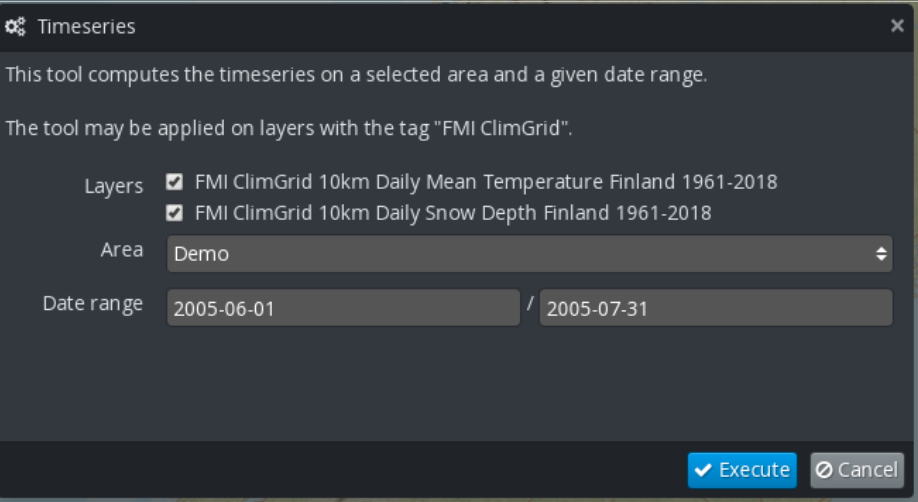
Figure 10 FMI ClimGrid Timeseries and Statistics: OpenSphere plugin
When the workflow execution reaches completion, a notification is sent by email.
- In the Dashboard, access the ClimGrid Statistics or the ClimGrid Timeseries component,
select the execution instance and visualise the generated data (Figure 11).
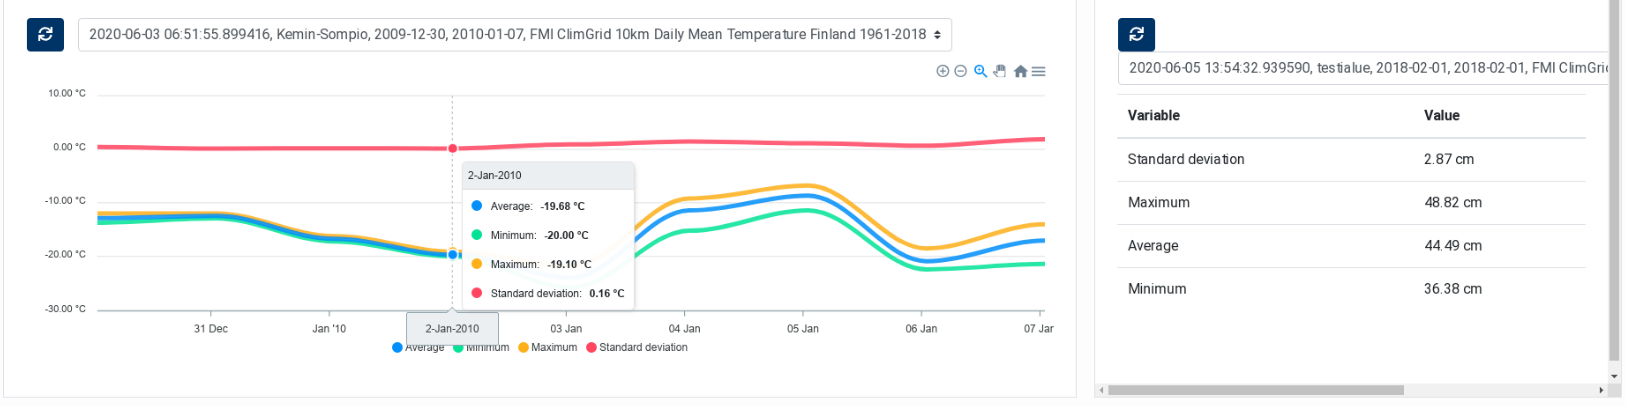
Figure 11 FMI ClimGrid Timeseries and Statistics: Dashboard Components
These two dashboard components are described in sections ClimGrid Time Series
and ClimGrid Statistics.
Notifications and Instant Messaging
The Notifications Dashboard contains the controls and components that allow users receive the notifications issued by the applications running in the EOPEN Platform. The integrated instant messaging system is the open‑source (Team Edition) of Mattermost (https://mattermost.com).
As three Pilot Use Cases (PUCs) are implemented in EOPEN, three dedicated Mattermost channels have been pre‑configured and may be used by the application developers to issue notifications from within their workflows.
The page, represented in Figure 13, contains at the top three buttons which allow opening the Mattermost Web Client in a separate window. Each of the three buttons opens Mattermost on a specific PUC channel (see Figure 14).
The Mattermost Web Client is however fully featured. It thus allows selecting and reading from any PUC channel, searching for notifications, and issuing new notifications.
The Notifications Dashboard also contains an integrated Mattermost message viewer. It is currently rudimentary and does not automatically refresh the content nor allows sending new notifications. The message viewer shows three buttons for selecting the PUC channel of interest and a “Refresh” button (double‑rotating arrows icon, on the left) for refreshing the content of the viewer.
Figure 13 shows the notifications issued by the Events Detection in Tweets Data service which is scheduled to run once a day:
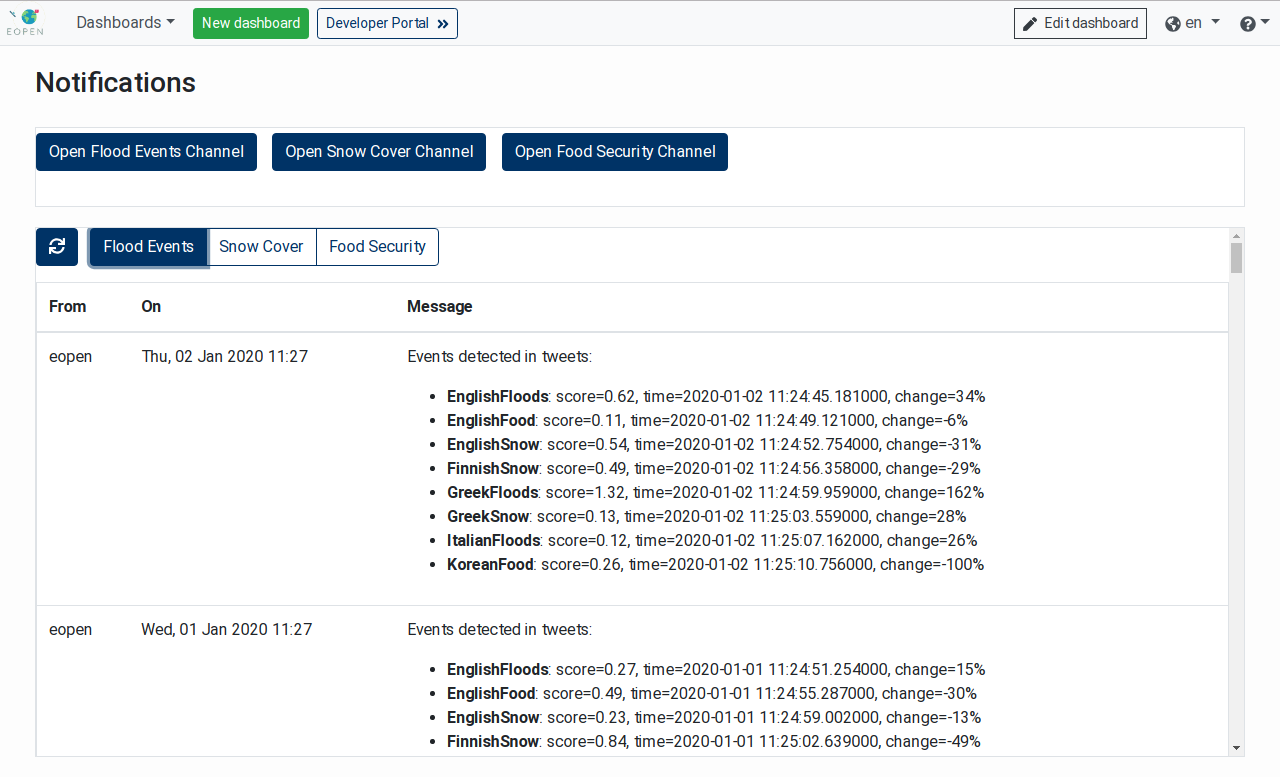
Figure 13 Notifications in the EOPEN User Portal
Figure 14 shows the same notifications displayed in the Mattermost Web Client:
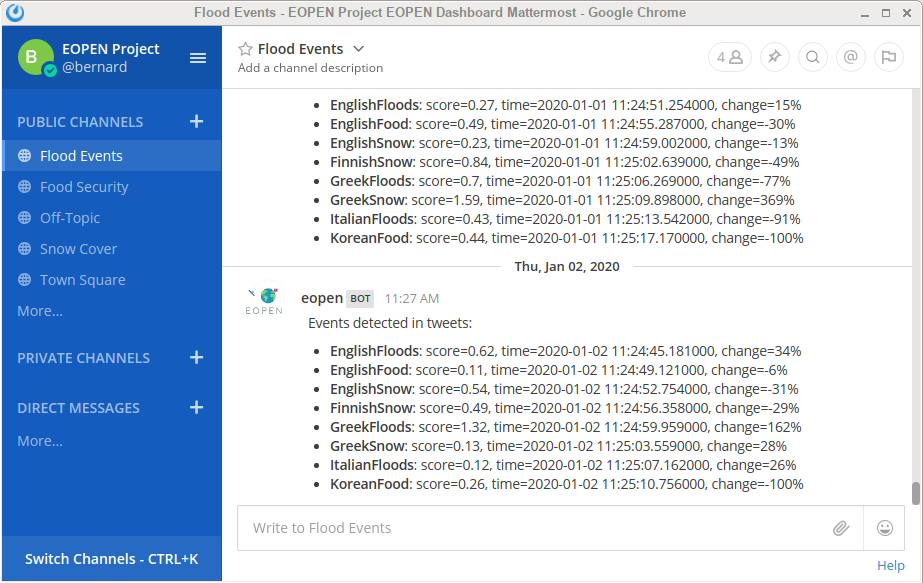
Figure 14 Notifications in the Mattermost Web Client
Creating Custom Dashboards
As indicated above in the site map section, users may create their own dashboards and integrate in them any combination of web component already available in the platform.
To create a new dashboard, click on the New dashboard button located in the page banner. A new page, shown on Figure 15, is displayed asking for the name and the description of the new dashboard. The name will be used to refer to the dashboard in the Dashboards menu.
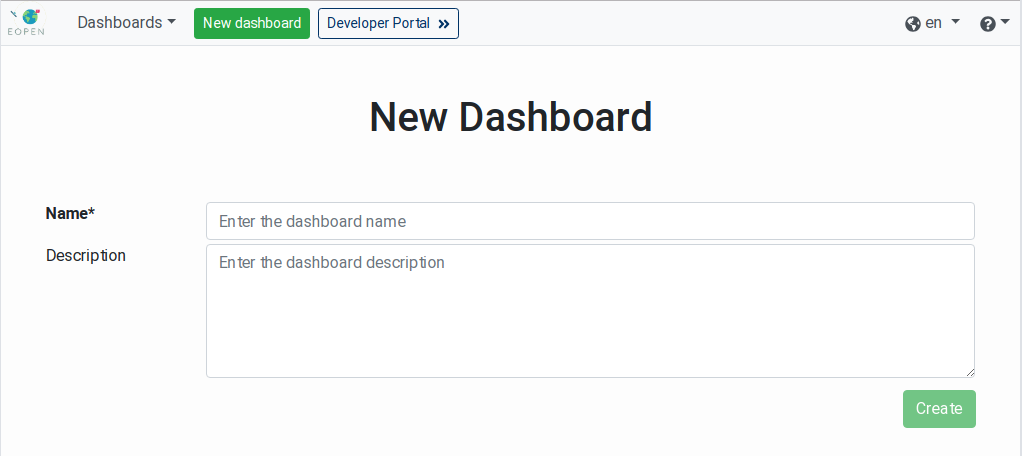
Figure 15 Creation of a New Dashboard
To cancel the creation of the dashboard, simply navigate to another page of the EOPEN User Portal. Otherwise, enter the dashboard name and description (optional) then click on the Create button.
The new dashboard is displayed. This contains an empty web component. The banner shows a new button labelled Edit dashboard and the “Dashboards” menu now includes the new dashboard:
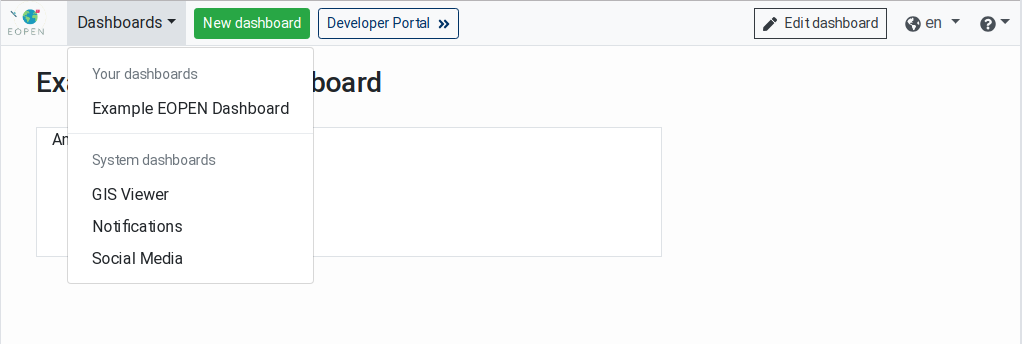
Figure 16 New (Empty) Dashboard and the Dashboards Menu
Click on the Edit dashboard button to enter the editing mode:
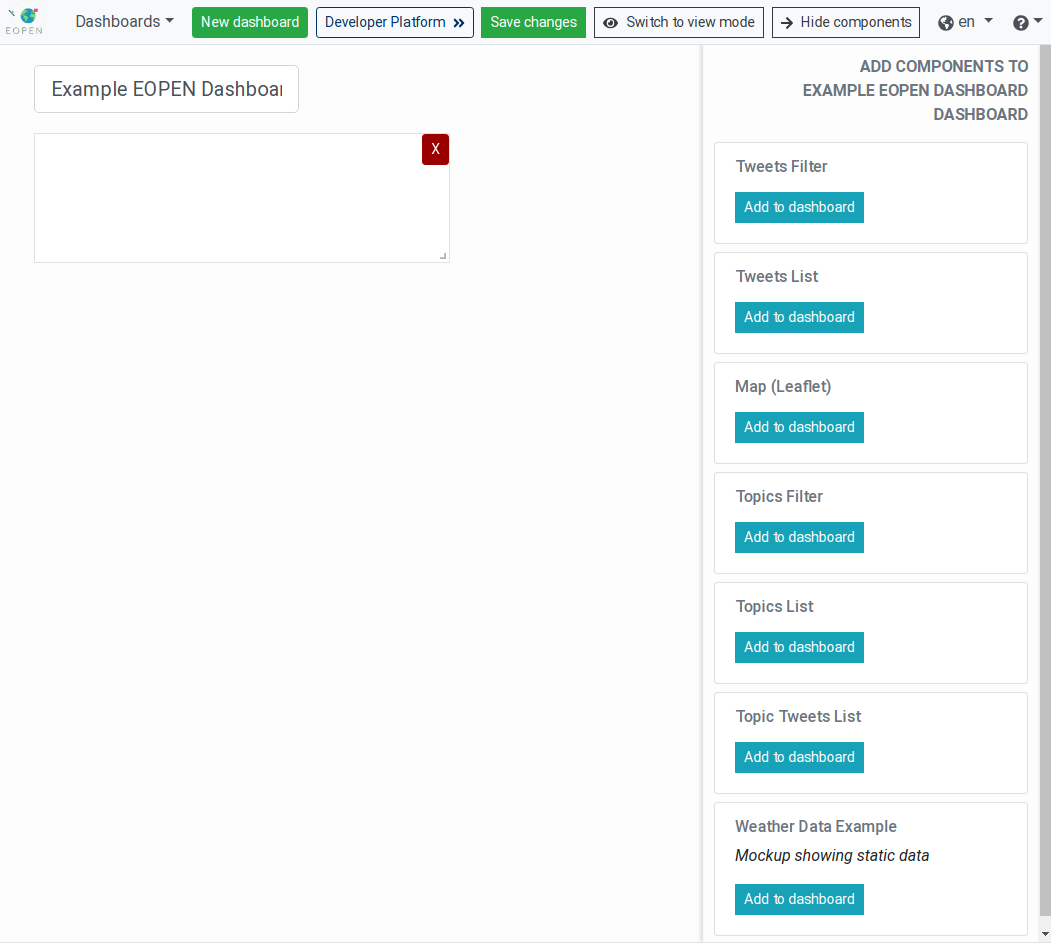
Figure 17 New Dashboard in Editing Mode
In editing mode, the page displays the following new elements in the banner:
A Save changes button which, when clicked, stores the new dashboard configuration on the server and quits the editing mode.
A Switch to view mode button which allows cancelling the changes and exiting the editing mode. When this button is clicked, a popup dialog box is displayed warning that all the modifications will be discarded and asking for confirmation.
A Hide components button for hiding the components panel (described below) while remaining in the editing mode. This is particularly useful to obtain a preview of the dashboard in normal mode.
The “components panel” located on the right side of the page lists the
web components currently available in the platform. Each of these is
individually described in Processes Management, below. Click
on a component Add to dashboard button to add a new instance of the
component into the dashboard.
On the dashboards, each component instance shows two controls:
An X in a red button located in its top‑right corner: Click on this button to remove the component instance from the dashboard.
An angle icon located in its bottom‑right corner. Click and drag this icon to resize the component.
To re‑arrange the components click in its center area and drag it around. A component will always be pushed upwards until it reaches the top of the dashboard or encounters another component.
Note: Some of the web components present in the list may already be included in one or more of the System Dashboards. It is for example the case of the Tweets Filter and the Tweets List. This does not prevent using them in other custom dashboards.
As indicated above, when the configuration of the new dashboard is finished, click on the Save changes button to store the configuration and exit the editing mode.
From now on, the custom dashboard may be re‑opened by selecting its name in the “Dashboards” menu located in the banner.
Modifying Custom Dashboards
A custom dashboard created as described in the previous chapter may be modified at any time by selecting it and then clicking on the Edit dashboard button located in the page banner.
The custom dashboard then enters the editing mode. Modify the dashboard as described above then click on the Save changes button to store the new configuration.
Available Graphical Components
This section introduces each available graphical (web) component.
Tweets Filter
The Tweets Filter component (see Figure 18) is used to filter collected tweets (stored in the EOPEN Platform) based on various search criteria. It is meant to be used jointly with the Tweets List component as all the tweets selected using this filter will be automatically displayed in the list.
Note: This component is present in the Social Media system dashboard
(see Social Media (Tweets) Viewer).
The tweets are filtered based on the pilot use case, their language, a date range and optionally on a word that must appear in the tweet message.
In addition, switches allow filtering out the tweets that do not include an image, have been re‑tweeted (i.e. they are not original), or which are considered as fake by the integrated fake tweets detector.
Clicking on either the start or the end date reveals a calendar in which a new date may be selected.
Click on the “Search” button to submit the filter and update the tweets in the Tweets List component described in the following section.
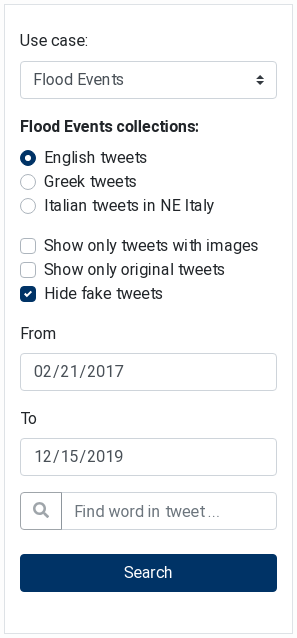
Figure 18 Tweets Filter showing search criteria
Tweets List
The Tweets List component (see Figure 19) displays tweets fetched from the EOPEN Platform. When combined with the Tweets Filter component, it displays the tweets matching the selection criteria.
Note: This component is present in the Social Media system dashboard
(see Social Media (Tweets) Viewer).
The Tweets List component displays the tweets in a paginated list. Controls located at the top allow selecting the size of each page (between 50 and 500 entries) and navigating between the pages.
A switch allows visualising the tweets on the Map (Leaflet) component if this is included in the same dashboard.
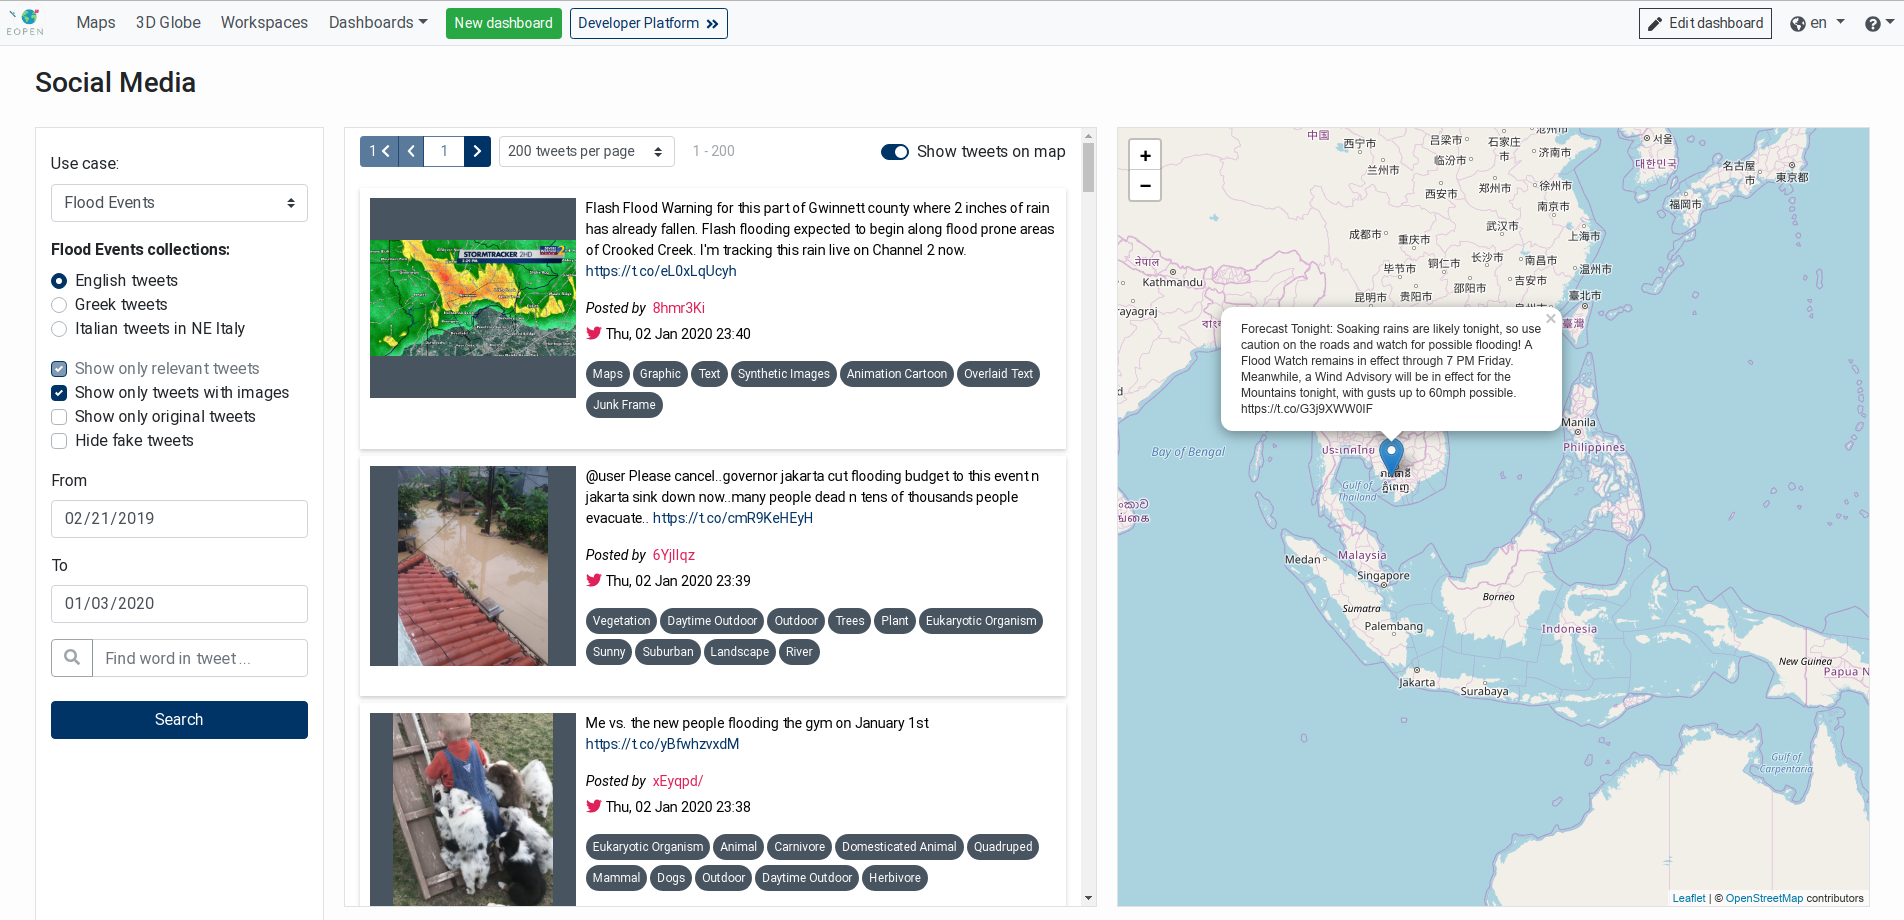
Figure 19 Tweets List showing matching tweets
Map (Leaflet)
The Map (Leaflet) component displays an interactive map (implemented with the Leaflet JavaScript library). It may be used to display simple features on a map.
Currently, only the Tweets List component makes use of the Map (Leaflet) component to display markers corresponding to the tweets estimated location. Clicking on a marker reveals the tweet message in a popup box.
Note: This component is present in the Social Media system dashboard
(see Social Media (Tweets) Viewer).
Topics Filter
Topics here are defined as groups of social media posts (i.e. tweets) that refer to a specific incident, subject, etc. and are produced by text clustering techniques. The Topics Filter component is used to select on which tweets collection topic detection will be performed and it is meant to be used jointly with the Topics List and Topic Tweets List components.
Topics Filter is a simple form where the user is able to first select the use case of interest and then the collection of interest. By clicking the Get recent topics button, a service searches for trending topics in the 400 most recent tweets of the selected collection and the detected topics are displayed on the Topics List component.

Figure 20 Topics Filter
Note: Search for topics in Korean tweets about food security is omitted due to the difficulty to handle their special characters.
Topics List
The Topics List component visualizes the trending topics in the tweets that are collected for the pilot use cases of EOPEN. When the search for topics, which can be triggered by the Topics Filter component, is completed, each of the detected clusters is presented as a word cloud, i.e. an illustration of the most mentioned terms per topic, where their frequency is shown with font size. Every time a word cloud is clicked, the complete set of tweets that are contained in the corresponding topic appear in the Topic Tweets List component.
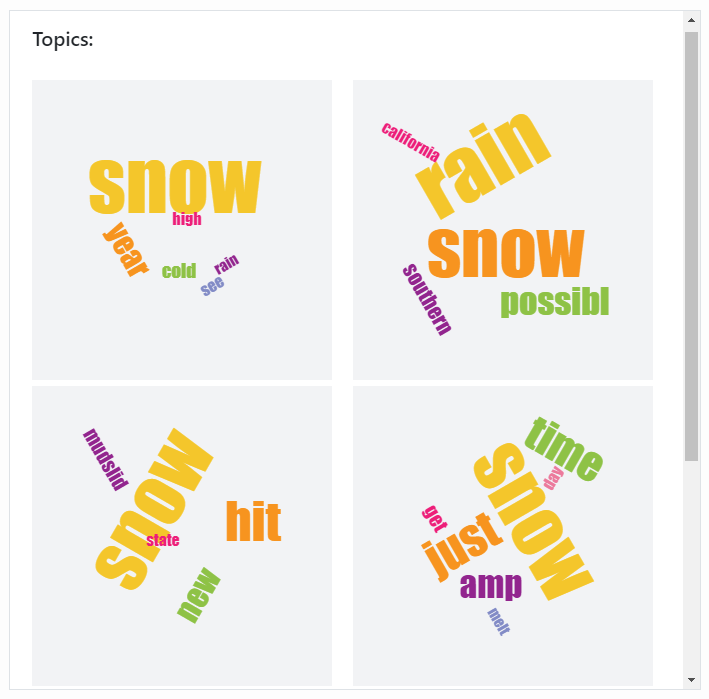
Figure 21 Topics List
Topic Tweets List
The Topic Tweets List component resembles the Tweets
List component (see Tweets List)
but contains only the posts of a specific topic. When a word cloud from
the Topics List component
(Topics List) is clicked, then the
Topic Tweets List is refreshed to display the tweets that the selected
topic comprises.

Figure 22 Topic Tweets List
Communities Filters
Community detection refers to the discovery of online communities of social media users, i.e. Twitter accounts that are interlinked by mentioning each other, while key-player identification is the discovery of most influential users in the above communities. The Communities Filters component is used to select the tweets collection the community and key-player detection will be applied on and is meant to be used jointly with the Communities Graph, Top Key-Player List and User Tweets components.
Communities Filters (Figure 23) is a form where the user is able to define the collection of interest by selecting the use case from a dropdown box and the language from radio buttons, while the time period can be defined by selecting a “from” date and a “to” date. By clicking the
“Get communities” button, the community detection service is called with the selected options as input parameters.
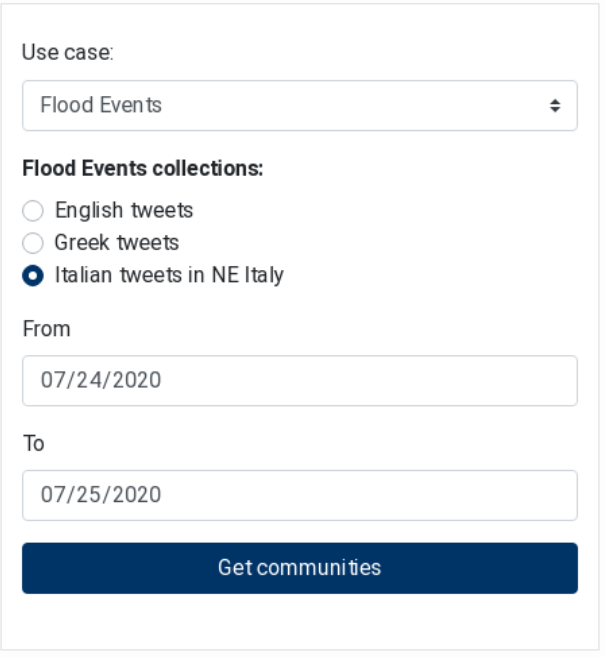
Figure 23 Communities Filters
Communities Graph
The results of the detection service are used to visualize in the Communities Graph component (Figure 24) the social network of Twitter accounts that are connected via mentioning each other. The unique users found in the pairs are displayed as nodes, pairing is displayed as edges between the two users/nodes, and communities are expressed as different colours of the nodes and edges. The IDs of the users are pseudonymised for privacy reasons. The graph can be zoomed in and out, to take a closer look at the detected communities.
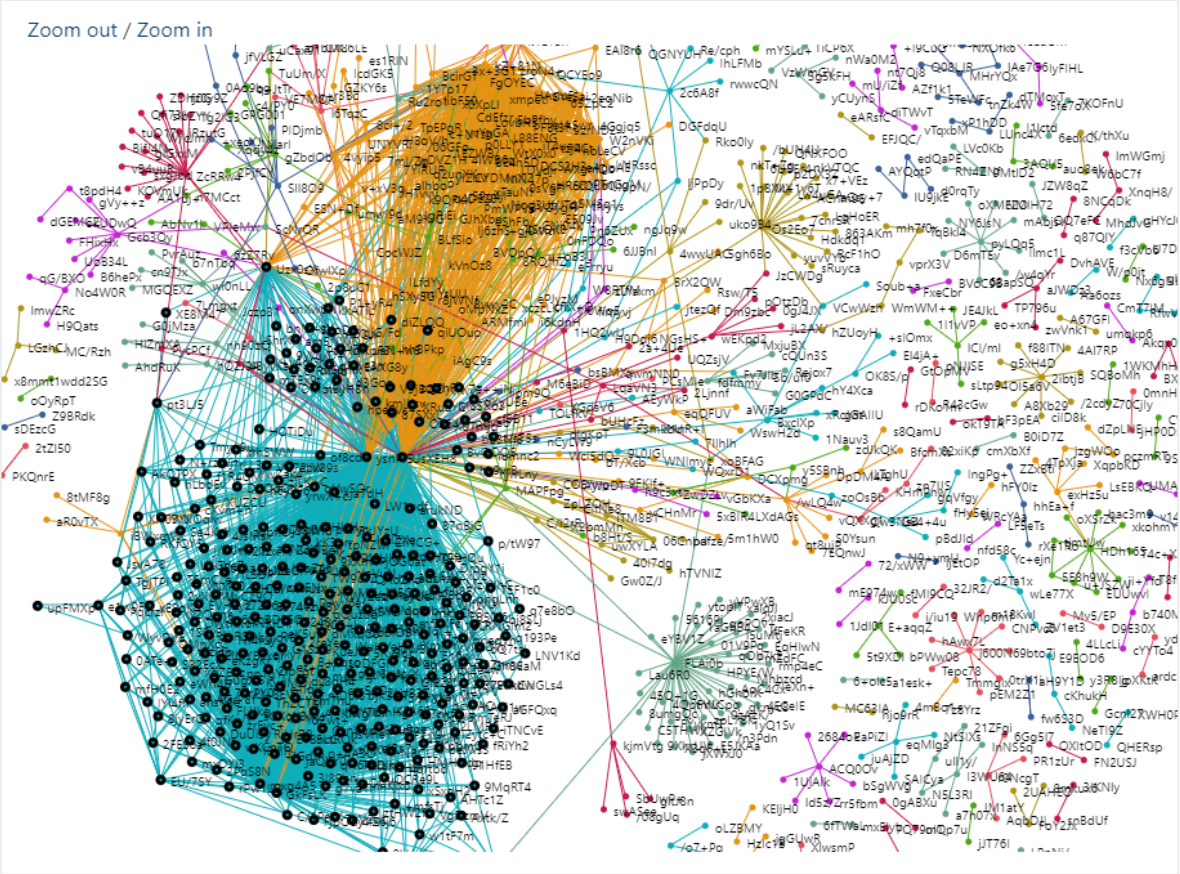
Figure 24 Communities Graph
Top Key-Player List
The community detection service also returns the top ten key-players that have central position in the communities and are considered influential to the other users on Twitter. The sorted list is displayed in the Top Key-Player List component (Figure 25), where the pseudonymized ID of each key-player and the community they belong to are shown. The community is mentioned by its ID, along with the number of users it comprises, and is also coloured with the same colour of the related nodes. When clicking on the coloured text, the nodes of the community are highlighted in the graph (see the bottom left community in Figure 24) to indicate the position of the community. For the visualisation of each key-player in the list, the Top Key-Player Card template is used.
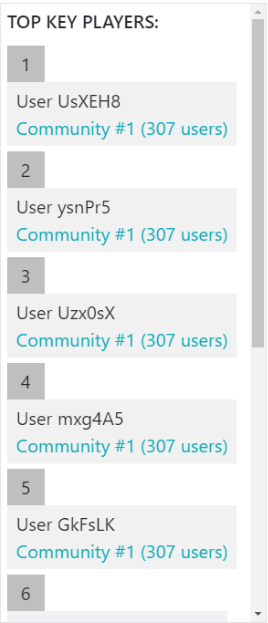
Figure 25 Top Key Players List
User Tweets List
When a node in the graph of Figure Figure 24 is clicked, then the tweets that have been posted by the respective user are displayed in the User Tweets List component (Figure 26). The Tweet Card template, already implemented from other social media-related components, is reused to show each single tweet in the list.

Figure 26 User Tweets List
ClimGrid Time Series
The ClimGrid Time Series component is used to visualise the timeseries data extracted
from the ClimGrid products provided by FMI. As described in GIS Viewer, above,
the information extraction is triggered via an extension implemented in the GIS Viewer OpenSphere.
The inputs to be provided are the area of interest (AOI) (which is given a name), a date range,
and the ClimGrid product to be processed.
After the processing, the result is made available via a drop-down list included at the top of the component. Each entry in the list indicates when the processing has taken p lace (date and time, the name of the AOI, the date range, and the name of the ClimGrid product. Click on the icon at the left of the list to reload the values from the server.
Select an entry in the list to display the corresponding timeseries in the chart. Four curves are displayed, corresponding to the average, the minimum, the maximum and the standard deviation of the values within the AOI.
The legend, below the chart allows to display or hide each of the curves. Controls in the top right corner allow zooming and panning in the chart as well as exporting the chart in SVG and PNG formats. Click on the house icon to re-centre the chart and reset the zoom level.
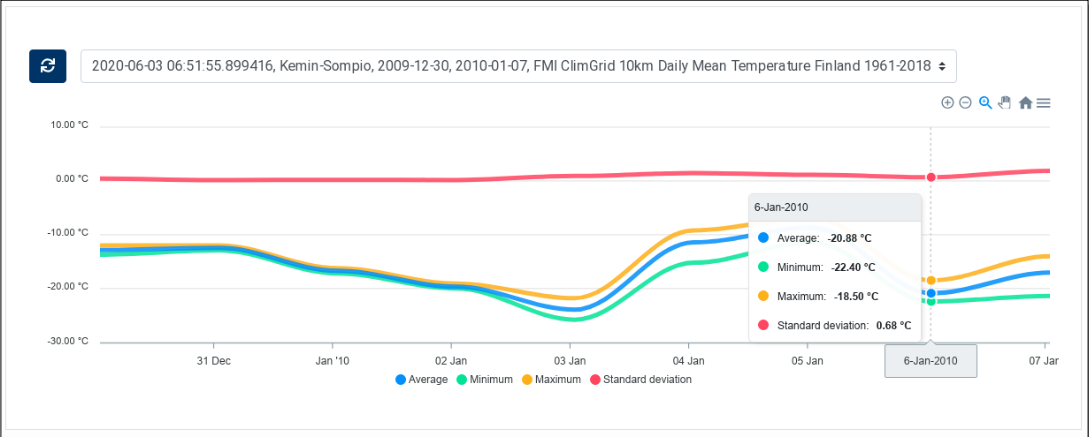
Figure 27 ClimGrid Time Series
ClimGrid Statistics
The ClimGrid Statistics component is similar to the ClimGrid Time Series component. It is also used to display data extracted from FMI ClimGrid products. The difference is that this component displays in a table statistical information extracted from the product on a specific day. As the other component, it contains two parts: a drop‑down list at the top, for selecting the processing execution, and a table that displays the extracted statistics.
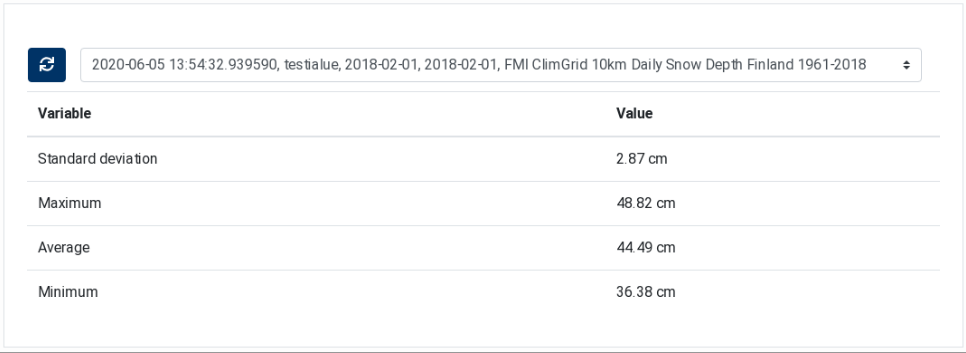
Figure 28 ClimGrid Statistics
Geo‑localised Linked Data
The Geo‑localised Linked Data component allows querying the EOPEN backend for Linked Data using an area of interest (AOI) and a time of interest (TOI), and to display the results on an interactive map.
The component contains a small form to select a date range at the top and a map to draw/edit the AOI and visualise the data. To draw a rectangle or a polygon on the map, select the corresponding icon in the left controls. Figure 29 shows the component with a selected AOI and the matching features (events, tweets and flooded areas). Figure 30 shows the date range selecting as well as tweet properties.
The component lets you draw only one shape, which appears in pink colour on the map. If you draw a new one, the previous one is removed. An existing AOI can be edited: use the “pencil” icon to enter the editing mode and click on the “save” button when done. Use trash icon to delete the AOI shape.
Click on the “Search …” button to search for data. This button is enabled only if a valid AOI and TOI are selected.
If the result list is empty, the text “No result” is shown next to the search button.
Results are displayed on the map and one layer is created for each feature type (flooded areas, tweets, events, etc.)
Using the control on the right side, you can choose the base map and the layers to be displayed or hidden.
The “Area of interest” layer contains the rectangle or polygon of the AOI, which may also be hidden.
Click on a feature on the map to display its properties in a popup.
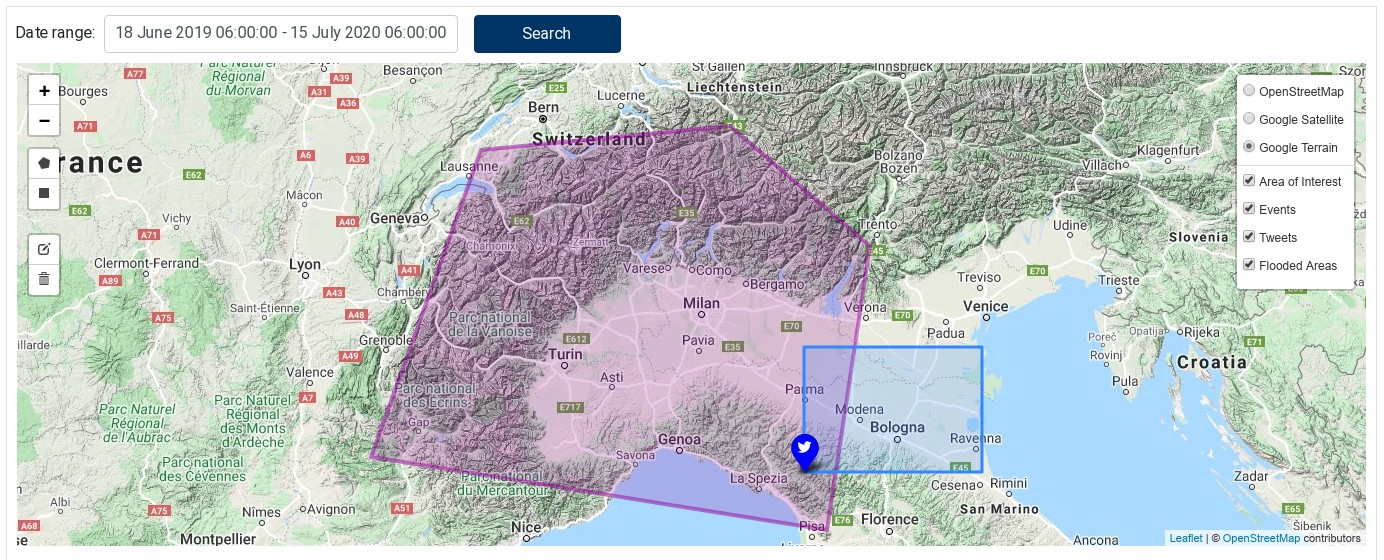
Figure 29 Geo-localised Linked Data showing a selected AOI and the matching features
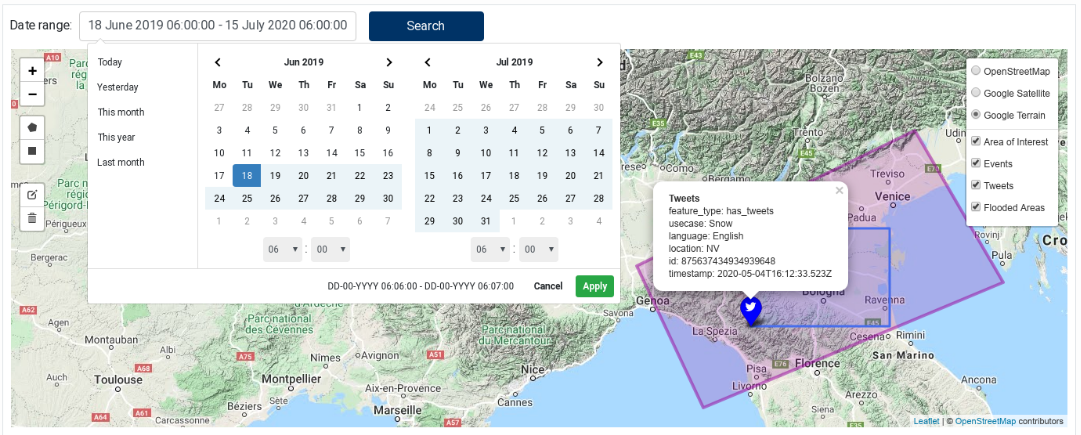
Figure 30 Geo-localised Linked Data showing the date range selection tool and tweet properties
EOPEN Developer Guide
Abstract
This document is the Application Developer Guide of the EOPEN Platform. Its purpose is to describe the various features supported by the EOPEN Platform and made accessible to the authenticated developer users through a standard Web browser. Each feature is described individually in a dedicated section.
Guidelines are also included to help developers create algorithms and applications.
Annexes include a glossary of the main terms as well as an inventory of the EOPEN modules available in the EOPEN Platform (D6.5).
The content of this document is part of the result of the work performed on T6.2 “EOPEN System Integration”.
Version |
Date |
Reason |
Revised by |
Approved by |
|---|---|---|---|---|
3/5-Aug-2020 |
Internal review |
Gilles Lavaux, Valentina Faccin, Gabriella Scarpino (Serco) |
||
1.0 |
19-Aug-2020 |
First release |
Authors |
Leslie Gale |
Organisation |
Name |
Contact |
|---|---|---|
SpaceApps |
Bernard Valentin |
|
SpaceApps |
Hakim Boulahya |
|
SpaceApps |
Leslie Gale |
|
CERTH |
Stelios Andreadis |
This document is the Developer Guide of the EOPEN Platform. Its purpose is to describe the various features supported by the EOPEN Platform and made accessible to the authenticated developer users, either through a standard Web browser, or an FTP client.
To access the EOPEN Developer Portal navigate to the home page of the EOPEN Platform (https://eopen.spaceapplications.com) and click on the Click here to access the Developer Portal button:

Figure 31 EOPEN Portal Home Page (Fragment)
Note: Credentials for authenticating in the EOPEN Developer Portal are created upon request.
The document describes each individual feature in a dedicated section. An end-to-end scenario is also included which indicates the logical sequencing of the usage of the features, from the off-line preparation of custom algorithms to the execution of workflows and the retrieval of the generated outputs.
This document focuses on the interfaces and the features available to developer users, not platform administrators.
Document Structure:
Chapter %sintroduces the EOPEN Application Lifecycle and describes a typical end-to-end usage scenario that covers all the steps that must be executed to develop a custom algorithm, import the algorithm in the Platform and integrate it in a workflow, execute the workflow and access the results.Chapter %sprovides a detailed description of each feature implemented in the Platform.Section %sincludes a site map which depicts how each feature is accessed in the Web interface and how the user may navigate between them.Appendix %sprovides the definition of the terms and concepts used in the EOPEN Platform.Appendix %scontains the inventory of the EOPEN modules integrated in the First EOPEN Prototype. Concretely, modules may have been implemented as processes, services or workflows, depending on their needs.Appendix %sinstructs on how SNAP graphs designed, tested and exported using the SNAP Graph Builder tool (integrated in the SNAP Desktop application) must be transformed into parameterised graphs that may be executed using the command-line Graph Processing Tool (GPT). This operation is necessary to allow deploying and executing SNAP graphs within the Platform.Algorithms not implemented in Python must be executed similarly, that is using a Python script to trigger the execution of a process using a system call. This applies for example to R, Java, and binaries (e.g. compiled C/C++ and Go).
Appendix %sgives example algorithms implemented in Python 3 that permit to execute various processes in the EOPEN Platform.
Main changes against the EOPEN Integrated Prototype Platforms:
The Processor and Workflow concepts have been merged in favour of Workflow. This removes the ambiguity that existed between a resource type (Processor) and its definition (Workflow).
A user who creates a Process or a Workflow is automatically registered as its owner. By default, Processes and Workflows are only visible and may only be managed by their owner.
The Workspace and user Role concepts have been introduced to allow sharing resources, including Processes and Workflows. The fundamental rule is that a particular resource is only visible by the users who are given a role in one of the workspace the resource belongs to. To share a resource, a user who has the right to do so assigns that resource to one or more workspaces.
The management of the users and their roles in the workspaces is under the responsibility of the platform administrators. This is thus not covered by the current document as it focuses on the features provided to the process and workflow developers.
Migration of the Python 2 based modules to Python 3.
Added support for GPU-enabled Worker Nodes, which may be explicitly selected for running processes that can benefit from a GPU (such as the Basement simulation application).
Workflow engine (Airflow) optimisation to mitigate the delays due to the orchestration mechanism.
The EOPEN Platform is based on the ASB Framework. This documentation describes features available
in version v1.1.3 of the ASB Framework. The version of the framework can be accessed in the
settings page, described in User Settings.
AOI |
Area of Interest |
API |
Application Programming Interface |
ASB |
Automated Service Builder |
EO |
Earth Observation |
EOPEN |
opEn interOperable Platform for unified access and analysis of Earth observatioN data |
ESA |
European Space Agency |
FSM |
Full Strip-Map |
FTP |
File Transfer Protocol |
GDAL |
Geospatial Data Abstraction Library |
GPT |
Graph Processing Tool |
GUI |
Graphical User Interface |
HTTP |
Hyper-Text Transfer Protocol |
JSON |
JavaScript Object Notation |
OGC |
Open Geospatial Consortium |
S1, S2, S3 |
Sentinel‑1, Sentinel‑2, Sentinel‑3 |
SNAP |
Sentinel Application Platform |
SpaceApps |
Space Applications Services |
VM |
Virtual Machine |
WFS |
Web Feature Service |
WMS |
Web Map Service |
WPS |
Web Processing Service |
Introduction
The EOPEN Platform is a tailored and customized version of the ASB framework. Available features include the possibility to upload custom algorithms, to integrate these algorithms within new workflows, and to run the workflows in a distributed environment.
This chapter introduces the successive steps to be followed from the local offline development of an algorithm to the retrieval of the generated outputs from the Cloud environment.
The EOPEN Application Lifecycle
Initially defined as the use case life cycle in the proposal, the application lifecycle depicts the steps to create an operational application (service). It comprises the following steps:
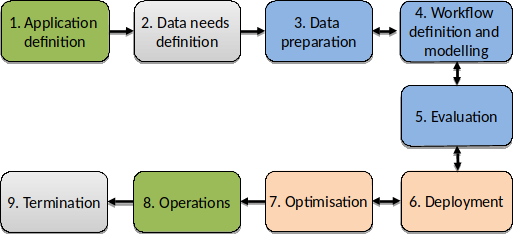
Figure 32 EOPEN Application Lifecycle
Steps 1 to 5 are performed to establish the concept and validate the models and verify the concept achieves the goals of the application. With respect to the EOPEN platform these are most often performed offline to EOPEN with the developers working on PCs and local servers using example data sets. These activities can however influence the eventual deployment of the concept to create an operational service. For instance the data may only be available on certain platforms, or by choice processing should be performed on a platform where the data is hosted to avoid excessive transfers of data.
Once the concept is verified and validated Steps 4 to 6 are performed using the EOPEN Platform. In general an application will comprise one or more algorithms organised in a workflow. The developer imports the algorithms into the EOPEN platform and using the designed workflow configures the imported algorithms using the workflow editor.
Some terminology is unavoidable. To avoid discussions on what is an application, what is a process …, the following terminology is used:
Process – A Process is a Dockerised Algorithm. A Process definition includes a name, description, and version, as well as (typed) input and output parameters, and software and hardware dependencies. The typed inputs and outputs allow ensuring the compatibility of the parameters inter‑connected in the workflows. The EOPEN Developer Portal comes with a Process Import Tool that automates the packaging and the registration of custom processes in the system.
Workflow – A Workflow implements a application by specifying the processes that must be executed together with their inter‑connections (data flow). The EOPEN Developer Portal includes a graphical Workflow Editor for creating workflows interactively, e.g. selecting the appropriate processes and connecting parameters with drag‑&‑drop. Workflows may be executed on-demand, scheduled or externally triggered. The platform automatically generates the parameterization forms that allow giving values to unconnected input parameters. EOPEN includes interfaces for monitoring and control, reporting and data access.
Additional concept definitions are provided in Appendix %s of this document.
Step 6, Deployment, is fully automated.
Initially Step 7, Optimisation, is not performed. It may also not be necessary prior to transferring to operation if no performance issue is detected. However should performance be an issue, or a shift to HPC is considered for instance then some re-organisation of the workflow may be needed. Another example is the use of SNAP. Experience shows that by breaking down a SNAP graph into sub-graphs leads to a substantial increase in performance. A developer may choose to do this right from the start, or after confirming the application is performing as expected.
Step 8, Operations, is in most cases performed in multiple stages. The first execution of the user application, execution of the Workflow, will be performed to reverify and revalidate the application. Once this is completed then the application is ready for operations.
Step 9, Termination, is performed to end the use of the application with the eventual off-line archiving of the results (output products). In the case of an EOPEN application this will follow the principles set out in the Data Management Plan.
End-to-End Usage Scenario
This section explains the steps that an application developer follows to make an application operational on the EOPEN platform. To perform the tasks EOPEN provides a Web-based user interface which is described in details in the next chapter. The table below introduces each step and refers to the detailed descriptions.
Lifecycle Step |
EOPEN Platform |
Steps 1 to 5 – Concept Phase |
Application Concept Development The EOPEN platform does not restrict the application developer in their choice of programming language, toolbox or libraries. Examples of the implementation can be a Python script using the GDAL for processing satellite imagery which can be tested on a local machine, or a SNAP graph edited and executed using the Graph Builder included in the SNAP Desktop application. When the application is considered ready, it may be imported in the framework. |
Steps 4 to 8 – Pre-operational |
Importing the developed algorithms Developed algorithms must be
imported in the framework using
the Process Import Tool. This is
a three steps process, as further
described in
Configuring a new workflow Imported processes must be
integrated in the workflow of
pre‑existing or new workflows
before being executed. To do so,
the Workflow Editor is used to
create and edit workflows,
integrating and inter‑connecting
processes in a graphical manner
(see Conclusion of the pre‑operational phase is the execution of the workflow as described in Step 8 – Operational. |
Step 8 – Operational |
Executing the workflow A workflow may be executed
on‑demand, through the Service
web interface. If the workflow
has unconnected inputs, these are
used to automatically generate a
parameterization form, as
described in
Alternatively, the platform
proposes to schedule the deferred
execution of the selected
workflow. A form allows
configuring a single deferred
execution or multiple executions
triggered at regular interval or
on specific days in the month.
The scheduler pages and controls
are described in
Monitoring the workflow execution and accessing the results Workflow executions are displayed
in two pages: the Recent
Executions page and the Execution
History page. The first page
displays the recent (started in
the last 24 hours) and the
on‑going executions. The second
page displays all the completed
executions without age limit. See
After the successful execution of
a workflow, an Execution Report
becomes available. This includes
the execution metadata, the
user-specified input parameters
(bounding box, time range, scene
identifiers, and other specific
input values), the list of
outputs and generated product
files, and if available
quicklooks of the output product.
The page also includes the
graphical representation of the
workflow graph and a Gantt chart
showing the times at which each
task in the workflow has been
executed. See
|
The EOPEN Developer Portal
This chapter describes the user interface of the EOPEN Platform for the application developers. Next section gives an overview of the available pages and the principal navigation links. The remaining of the chapter describes the pages, the operations and the related Platform behaviour.
Site Map
Figure 33, below, shows the structure of the Platform user interface. Each box represents a Web page and the arrows show the navigation between the pages. Not all navigation links are represented, however. For example, logging out on any of these pages redirects the user to the EOPEN Developer Portal Home Page (grey box on the left).
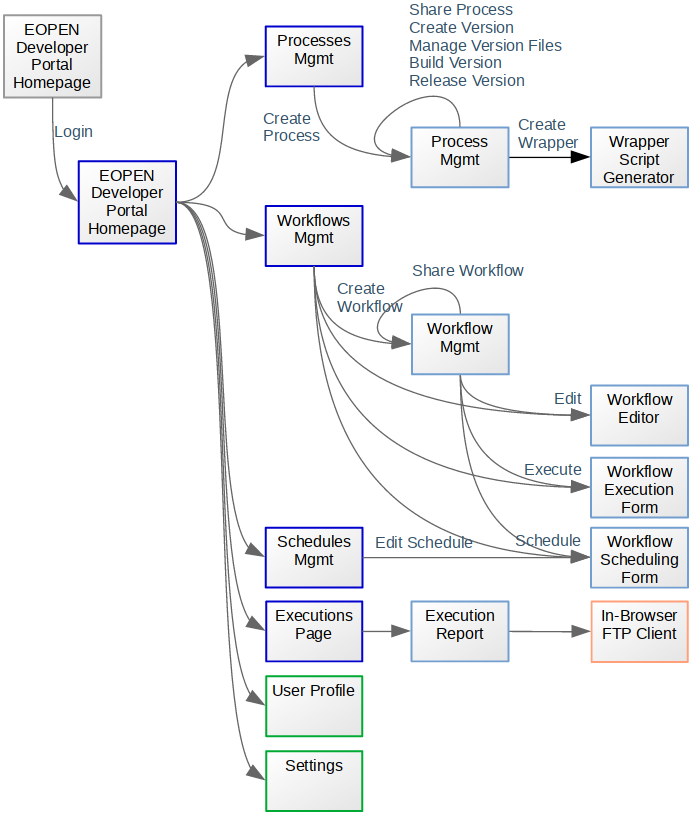
Figure 33 EOPEN Developer Portal Site Map
Home Page
The EOPEN Developer Portal Home Page (https://eopen.spaceapplications.com) is the only page accessible to non‑authenticated users. The page body informs about the EOPEN project and the Automated Service Builder (ASB) framework on which the EOPEN Platform is built. It shows in its banner a link for logging‑in.

Figure 34 Home Page for Non‑Authenticated Users
Click on the Log in link to open the User Authentication Form.
User Authentication
The User Authentication Form is displayed when the Log in link located in the page banner is clicked. The form lets you enter your name and password. The Go back to the home page link allows aborting the login process and navigating back to the EOPEN Developer Portal Home Page.

Figure 35 User Authentication Form
After a successful authentication, the browser is redirected to the EOPEN User Portal. Click on the Developer Portal button to navigate back to the Developer Portal.
Header Panel
Once authenticated, the top part of the Web pages is extended with links and menus that give access to the different features of the platform:

Figure 36 Header Panel
The header panel provides the following elements:
Label |
Target |
Section |
The EOPEN icon |
EOPEN Developer Portal home page |
|
Processes |
Processes Management pages |
|
Workflows |
Workflows Management pages |
|
Schedules |
Schedules Management pages |
|
Executions |
Executions Inspection pages |
|
<user-name> |
User profile and settings menu |
|
User Configurations
User Profile
The user profile page, shown in Figure 37, shows the user information as username, name, email, login details, permissions and roles.
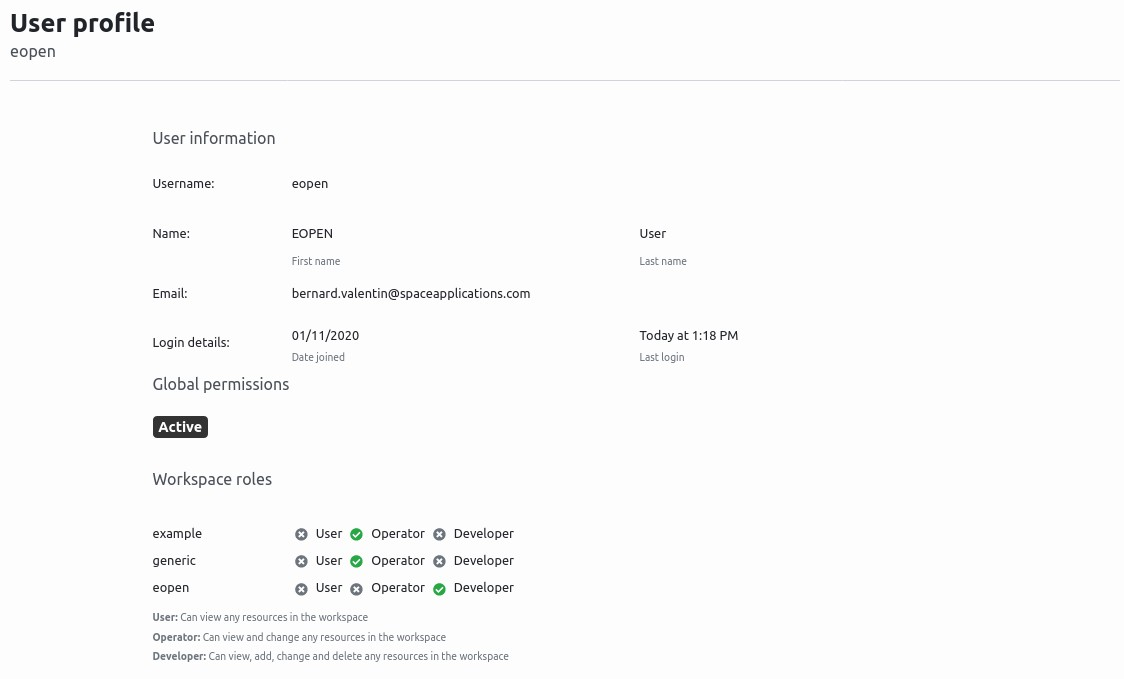
Figure 37 User Profile Page
User Settings
User settings provide information on the platform and some configuration to the user. The settings page can be accessed by clicking on the username in the Header Panel, as shown in Figure 38.
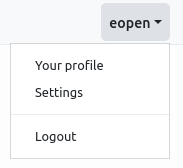
Figure 38 Settings Dropdown Link
The settings page, shown in Figure 39, provides the name of the platform, the version and user settings.
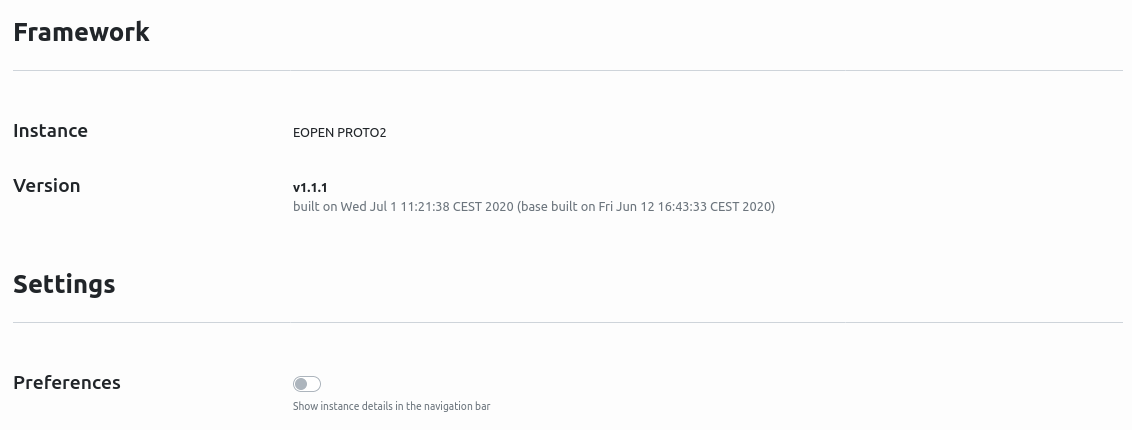
Figure 39 Settings Page
Processes Management
Process Development Lifecycle
A Process, and more specifically a Process Version, is a single unit of execution. Custom processes and versions may be added in the platform by the developers by executing the following steps, depicted on Figure 40:
Create a process in the platform (section
Creation of a New Process).This is an initialisation step required to declare the process and start working on it.
Create a new process version (section
Creation of a new Process Version).Initially, a process version has no implementation files. These must be uploaded in a following step. Concretely, it means the process version may not be built and released yet. Its status is “Unreleased”.
Generate and prepare a process wrapper script (section
Generation of a Process Wrapper Script).A process wrapper script acts as an adapter between the service interface that will allow executing the process remotely and the process implementation files. This step is not represented in Figure 40.
Upload the wrapper script and the process implementation files (section
Upload of the Process Version Implementation Files).This is an interactive step. Files can be added and overwritten until all the files required to implement the process have been uploaded. As long as no valid wrapper script (whose name must be process_wrapper.py) has been uploaded the status of the process version remains “Unreleased”. As soon as a valid wrapper script has been uploaded, the status changes to “Buildable”.
Note: Importing and testing processes in the EOPEN platform is not as straightforward as executing a Python script offline, on a local system. It is thus advised, in order to same time, to test new algorithms locally before importing them in the platform. Ideally the test should involve the wrapper script as well. This is further described in
Testing Processes Off‑line.Build the process version (section
Building the Process Version).At this step, the process version implementation files are packaged and tested and a dry‑run of import is performed. This step is important to determine if the uploaded files can be compiled and loaded to start serving a processing service.
If the build is not successful, new implementation files may be added or replaced before trying a new build.
If the build is successful, the status of the process version becomes “Releasable”. At this point, it is still possible to add or replace the implementation files.
Release the process version (section
Releasing a Process Version).At this step, a build is performed again and the resulting package is registered in the platform as an executable process. From this point, the status of the process version becomes “Release” and no changes may be applied to the implementation files anymore. The process version may be selected and integrated in Workflows (see Workflows Management in
Workflows Management).
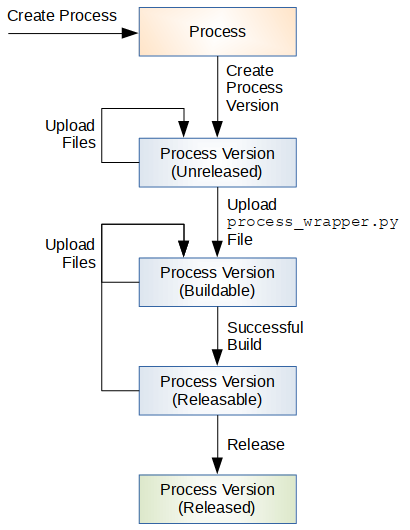
Figure 40 Process Development Lifecycle
At any time a process may be shared (with all its existing and future
versions) with other platform users by adding it to one or more
workspaces. Instructions to do so are provided in
Process Sharing.
The following sections further describe each of the process management tasks.
Processes Management Page
The Processes Management Page, titled Processes, gives access to the tools for creating, configuring and sharing processes.
As can be seen on Figure 41, the page contains the following elements:
A table of existing processes (accessible by the authenticated user).
Each process is prefixed with the name of its owner that is the user who has created it. Different user names may be present in the list as processes can be shared among users (see
Process Sharing).A field for applying a textual filter on the table
A New process button for creating a new process
Click on a process name to navigate to the Process Management Page as described in the next section.
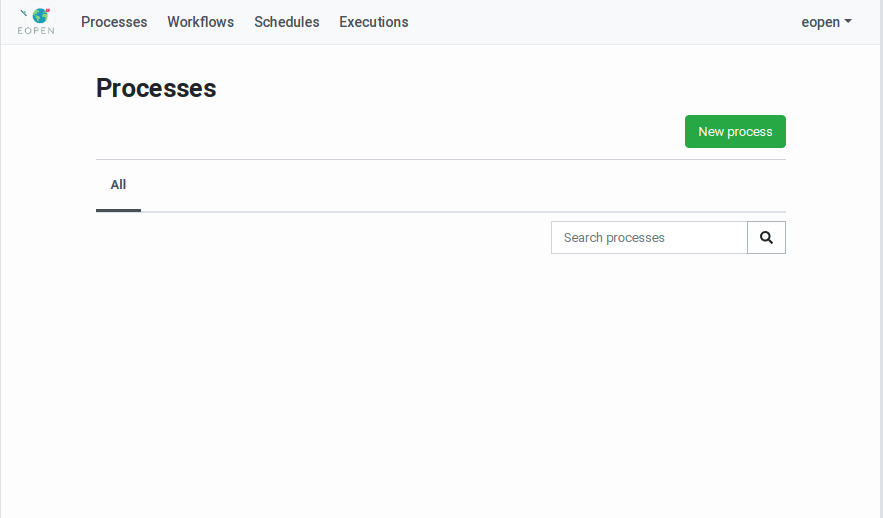
Figure 41 Processes Management Page
Creation of a New Process
Clicking on the New process button reveals a popup dialog box which asks for the name of the new process (see Figure 42). The process name is a free text that will be used to identify the process in the user interface. At the same time the name is entered, a “slugified” version of it is generated automatically and displayed in a second input field. It is in principle not necessary to edit this generated identifier but should it be necessary, care must be taken to enter an identifier that only contains lowercase characters, dashes and digits.
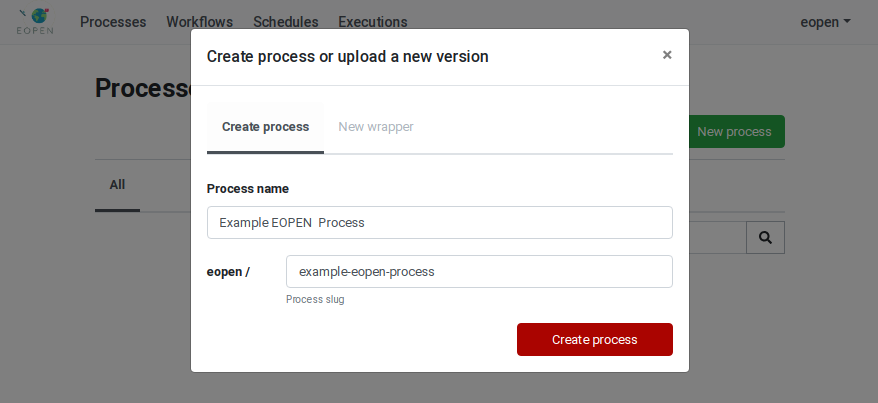
Figure 42 Creation of a new Process
Enter valid values then click on the Create process button to create the process. You are automatically redirected to the Process Management Page:
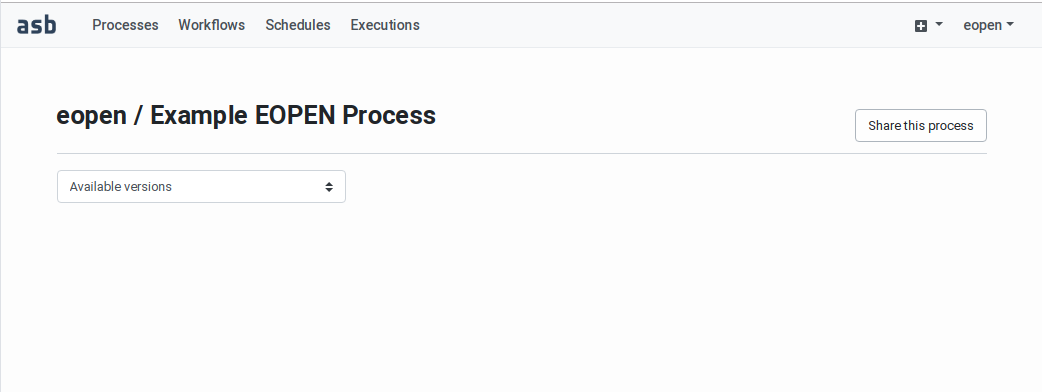
Figure 43 Process Management Page
On the screen, the process name is always prefixed with the name of its owner.
The Process Management Page also contains the following elements:
A Share this process button for configuring in which workspaces the process should be accessible (see
Process Sharing).- A New wrapper button for generating a process wrapper script (see
Generation of a Process Wrapper Script).
- A New version button for creating a new version of the process (see
Creation of a new Process Version).
The currently associated workspaces (not displayed if the process is not shared)
A drop‑down list with the existing process versions. Selecting a version in the list reveals information about the version as well as buttons for managing that version, as will be explained in the next section.
Creation of a new Process Version
In order to create a new process version, navigate to the related Process Management Page. The page includes the list of existing Process Versions in a drop‑down list and a New version button. Click on this button once reveals a Click again … button. Click on it to confirm and start working on a new process version.
As shown on Figure 45, the process version has the
status “Unreleased”. The page now shows an area for uploading the
process version implementation files. Its usage is described in
Upload of the Process Version Implementation Files.
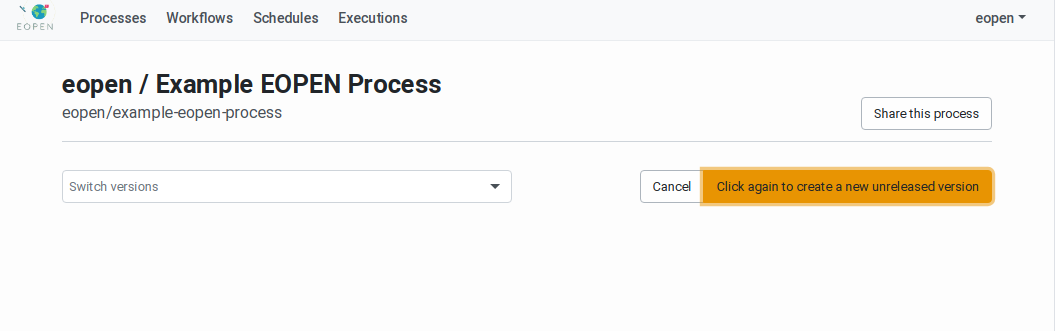
Figure 44 Process Management Page with New Version Confirmation Button
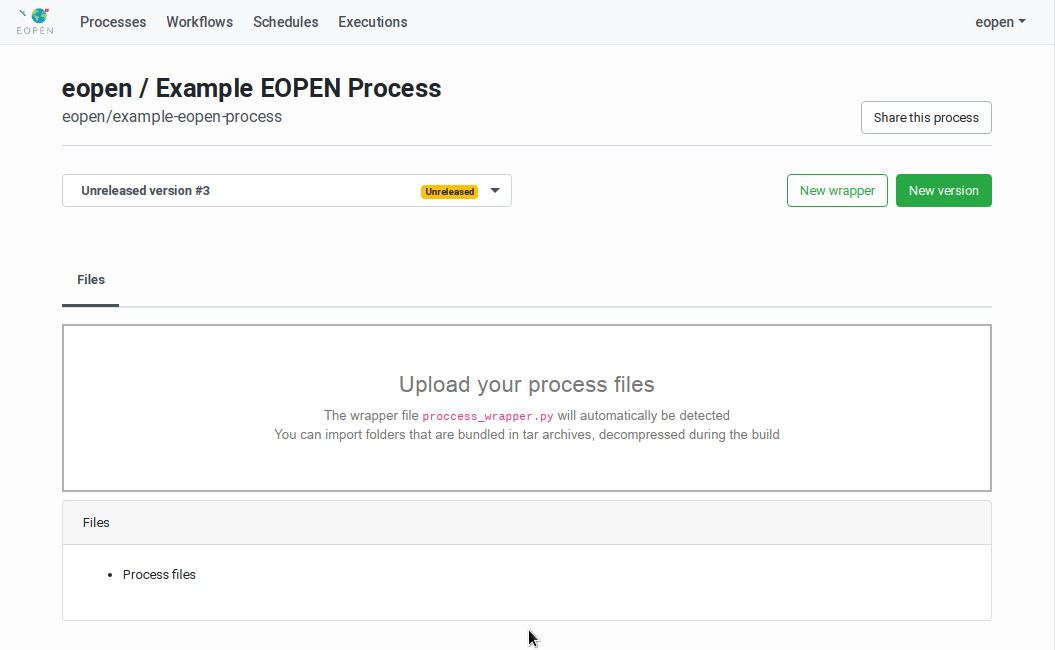
Figure 45 Process Management Page with Selected Version
Generation of a Process Wrapper Script
For each process version to be imported in the platform, it is necessary to generate a corresponding process wrapper script. This script acts as an adapter between the platform and the actual process implementation.
The creation of a wrapper script is facilitated by the Process Wrapper Script Generation page which may be accessed by selecting a particular process version and clicking on the New wrapper button.
The page, represented on Figure 46, allows generating a preliminary version of the script. This must be downloaded and edited locally to include the call to the process algorithm (or to include the algorithm itself). The input parameters received by the wrapper function must be passed to the algorithm and the algorithm outputs must be returned by the wrapper function. Passing the input and output parameters must be performed in the appropriate manner, that is, according to the rules of the Python language.
The Process Wrapper Script Generation page is divided in two parts:
The left panel is occupied by a form that allows configuring the process. In particular, it allows declaring the list of input and output parameters, the software dependencies and the hardware dependencies.
The right panel contains the generated wrapper script. This is dynamically updated each time a modification is applied in the form on the left. For example, when a new input parameter is added in the form, this is inserted as an input to the execute functions, and when a new output parameter is added, a corresponding variable is created and initialised in the function, and included in the returned dictionary.
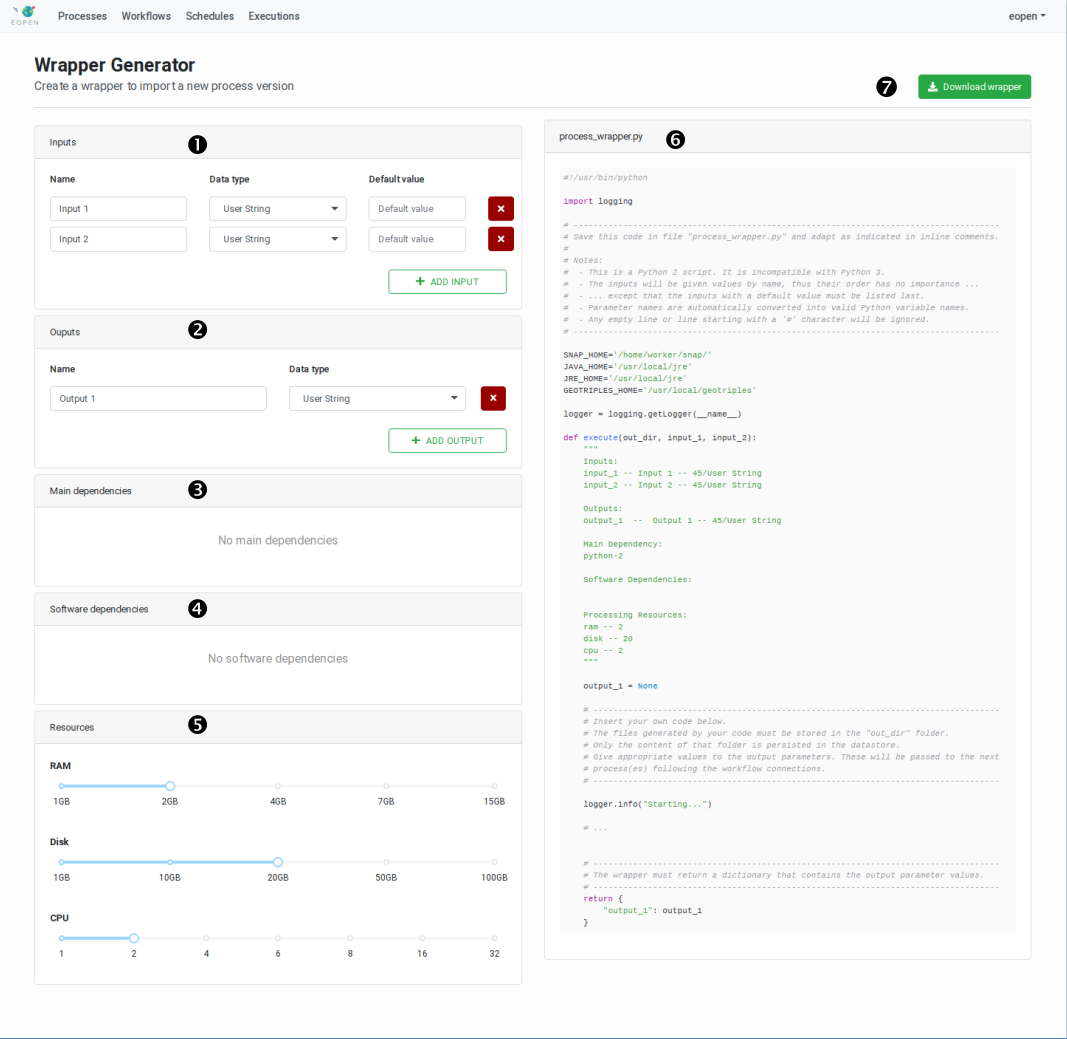
Figure 46 Process Wrapper Script Generation Page
The Process Wrapper Script Generator page displays the following elements:
1 |
Definition of the input parameters. Click on the ADD INPUT button to declare a new input parameter. Give a name and optionally a default value to each input in the list and associate them to a data type. |
2 |
Definition of the output parameters. Click on the ADD OUTPUT button to declare a new output parameter. Give a name to each output in the list and associate them to a data type. |
3 |
Select in this panel the main software product required to run the algorithm. For example, select “R Interpreter and Libraries” if at least part of the algorithm is implemented in the R scripting language, or select “SNAP + Sentinel Toolbox v7.0” if the algorithm makes use of the SNAP command line tools (including GPT and Snappy). |
4 |
Select here the additional software packages your algorithm depends on. Python is installed by default in all process Docker images. Several entries may be selected but, for example, it doesn’t really make sense to install more than one version of the Java runtime environment. The selected packages will be installed in the process Docker image at import time. The amount of selected dependencies thus impacts the time required to build these images. |
5 |
Indicate here the minimum amount of hardware resources required to run the process. The process will not be deployed and executed in a node that has less than the required resources available. If more resources than required are available (e.g. 4 CPUs required but 8 available), the process will have the possibility to use them. |
6 |
The right half of the page shows the dynamically generated process wrapper template. This is updated automatically when new values are entered or selected in the form on the left. |
7 |
The Download wrapper button triggers a download of the process wrapper template. This is named “process_wrapper.py” by default. Depending on the Web browser configuration, the download happens automatically or the target location is asked at first. |
Enter the necessary information in the form then click on Download wrapper to save the generated process wrapper template next to your algorithm files (if any).
Important: The name of the file (process_wrapper.py) must be preserved otherwise it will not be recognized as a wrapper script at import time.
Edit the “process_wrapper.py” file and add within the “execute” function the Python 3 code that takes the function input values, run your algorithm, and returns the execution results. If the code of the algorithm is short enough, it may be directly integrated within the “execute” function.
When this is done, the algorithm files and the “process_wrapper.py” file
should be tested locally (see Testing Processes Off‑line) then
uploaded in the platform. These operations are described in the next
sections.
Upload of the Process Version Implementation Files
When a process version is selected in the Process Management Page the page displays a panel titled “Files” (see Figure 45). The panel contains a “drop‑off” zone that allows to drag and drop the process version implementation files directly on the page. Alternatively, clicking on the zone opens a dialog box that allows navigating and selecting the files to upload.
Each time one or more files are dropped or selected for upload, these are sent to the server where they are analysed. If one of these files is named process_wrapper.py and contains a process wrapper script, this is parsed and the process properties extracted.
Note 1: Several files, organised in a folder hierarchy may be uploaded as
well. Instructions to do so are provided in Importing a Folder Hierarchy.
Note 2: Additional Python packages may be installed automatically in
the Docker image by uploading with the process version implementation files
a “requirements.txt” file that will be provided to the standard “pip” tool.
This is further described in section Installing additional Python Packages.
When a valid process_wrapper.py file is uploaded, possibly with additional implementation files, new tabs become available:
Build: Use this tab to package the files and release the process version in the platform as explained in
Building the Process VersionandReleasing a Process Version. (Figure 48).Properties: Use this tab to visualise the process version metadata (encoded in JSON) as extracted from the process_wrapper.py file (Figure 49).
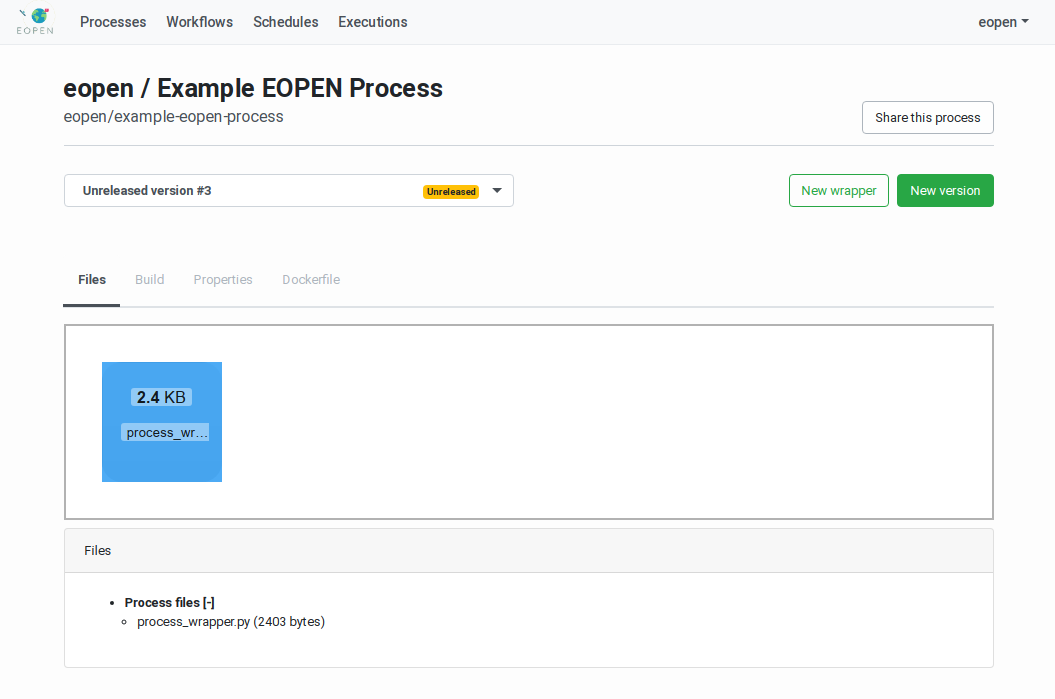
Figure 47 Process Version showing the uploaded files
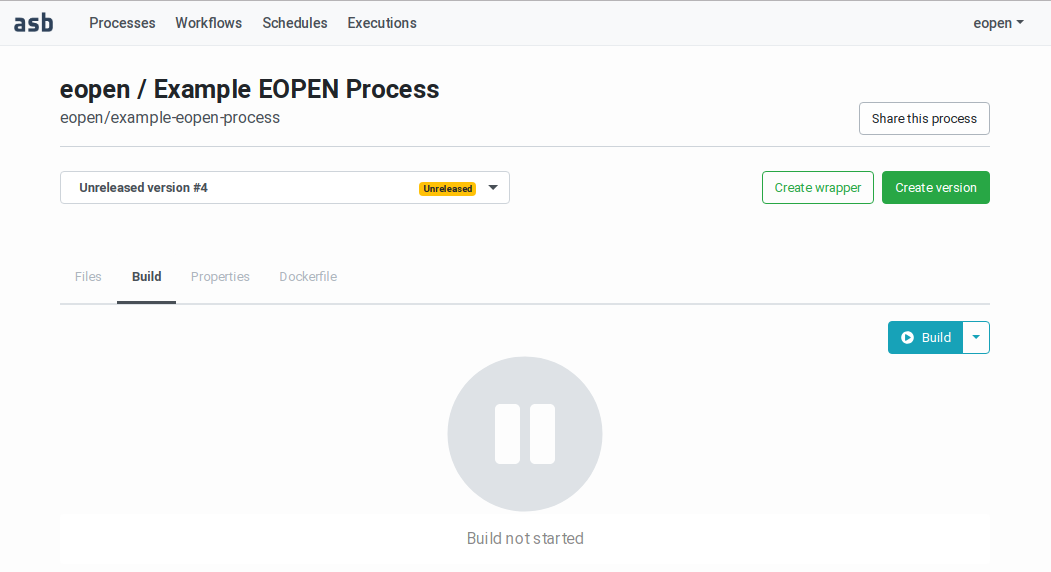
Figure 48 Process Version showing the Build panel
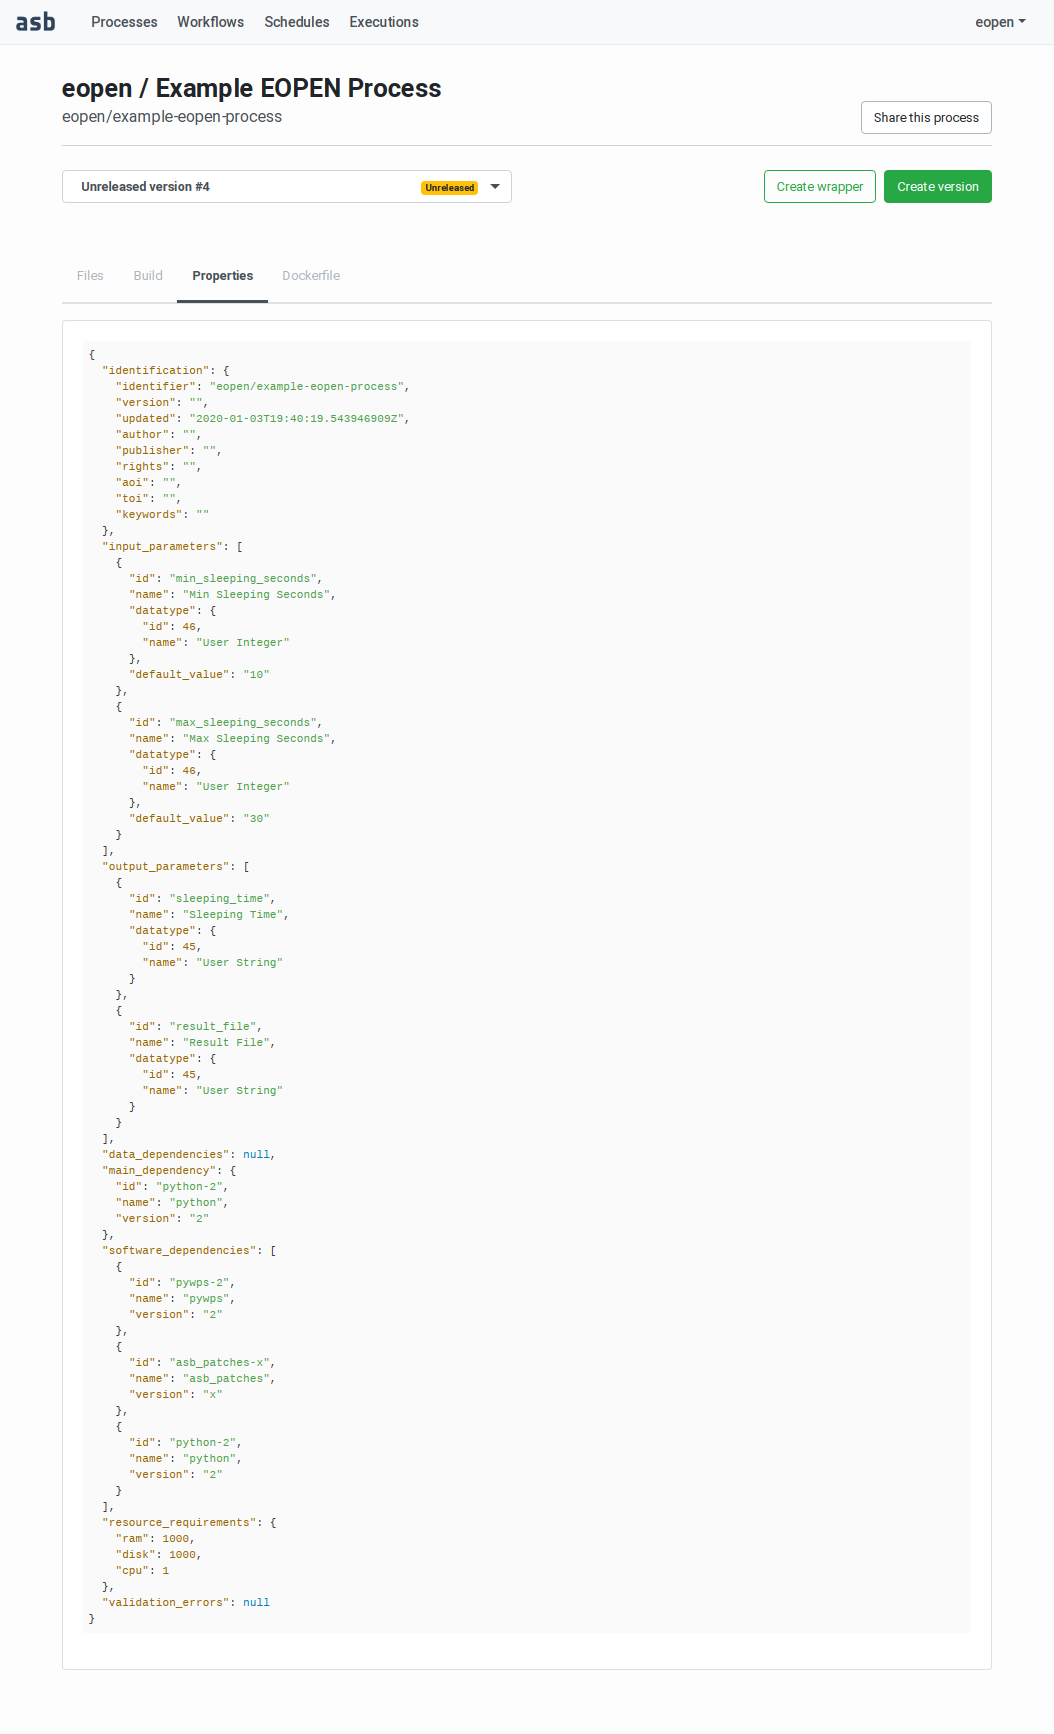
Figure 49 Process Version showing the process properties
Building the Process Version
To build a new process version, navigate to the related Process Management page, select the version to build in the drop‑down list then click on the “Build” tab. The build panel is then displayed as shown on Figure 48.
Note that this tab is only accessible if a valid process wrapper script has been uploaded, as explained above.
The “Build” tab contains a Build button. Clicking on it starts a build and a release dry‑run. As can be seen on Figure 50, the page displays messages that inform about the progress of the dry‑run steps. The messages are pushed from the server to the browser and thus appear automatically in real‑time.
The build operations may take some time, varying with the amount of software dependencies selected in the Process Wrapper Script Generation page. Each additional software dependency represents one or more installation operations to be added in the build script of the target Docker image.
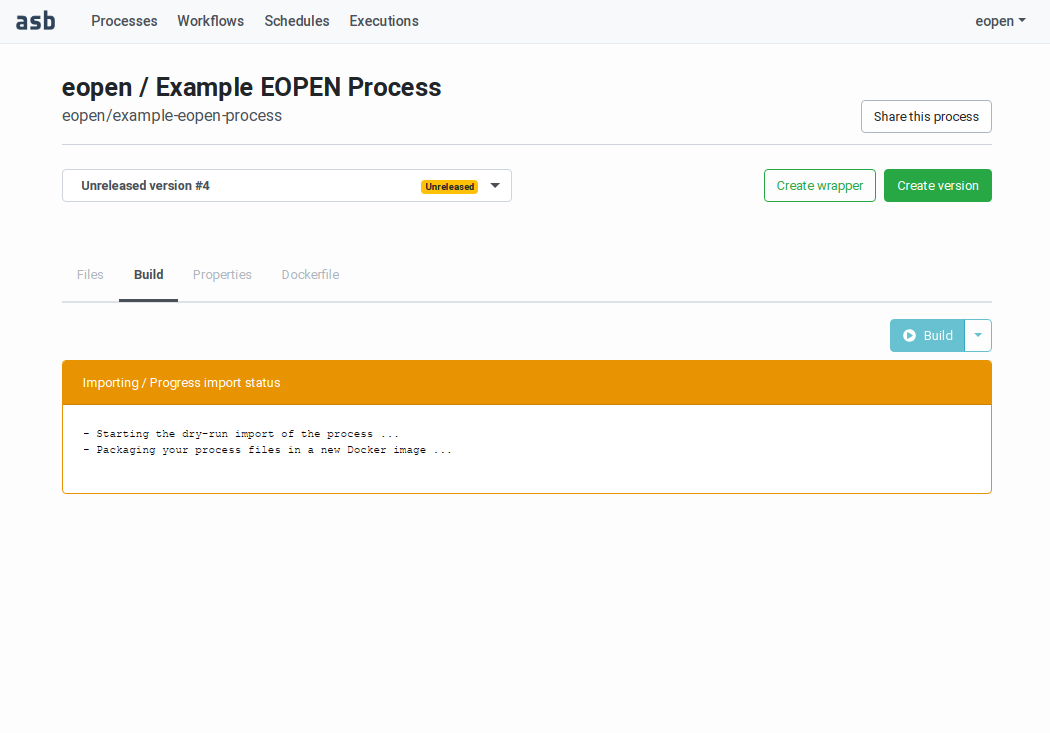
Figure 50 Building a Process Version (on‑going build)
If the build or the release dry‑run fails, the panel turns red and a description of the error is displayed, as shown on Figure 51:
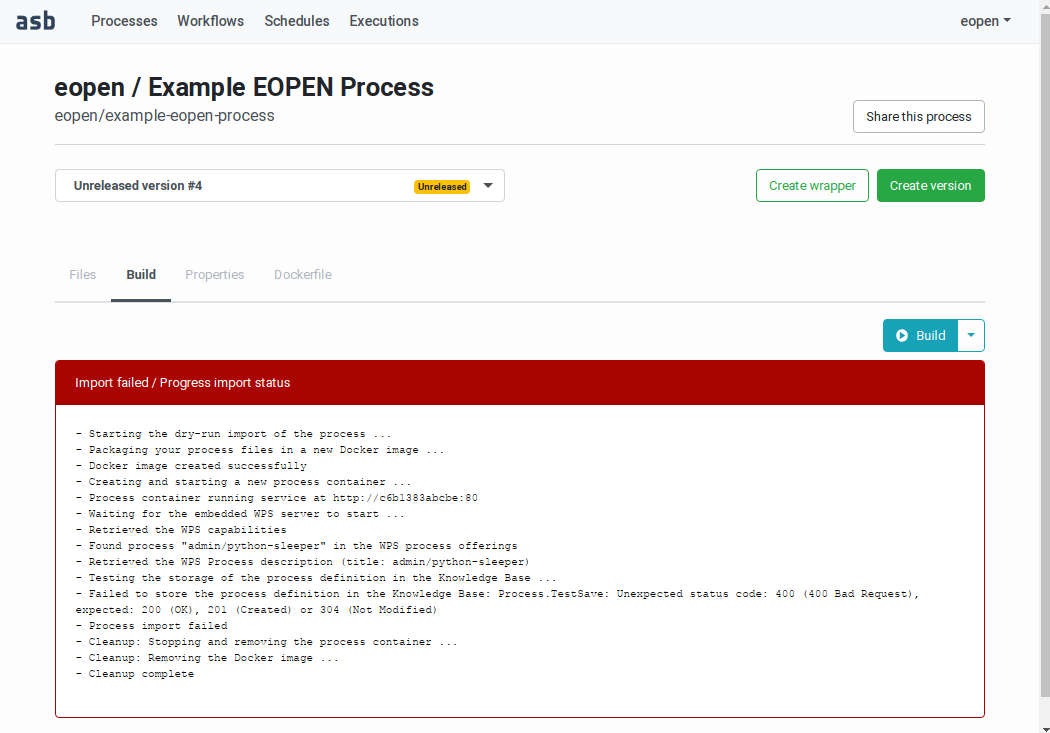
Figure 51 Building a Process Version (failed build)
If the dry‑run import is successful, a green panel is displayed, as shown on Figure 52:
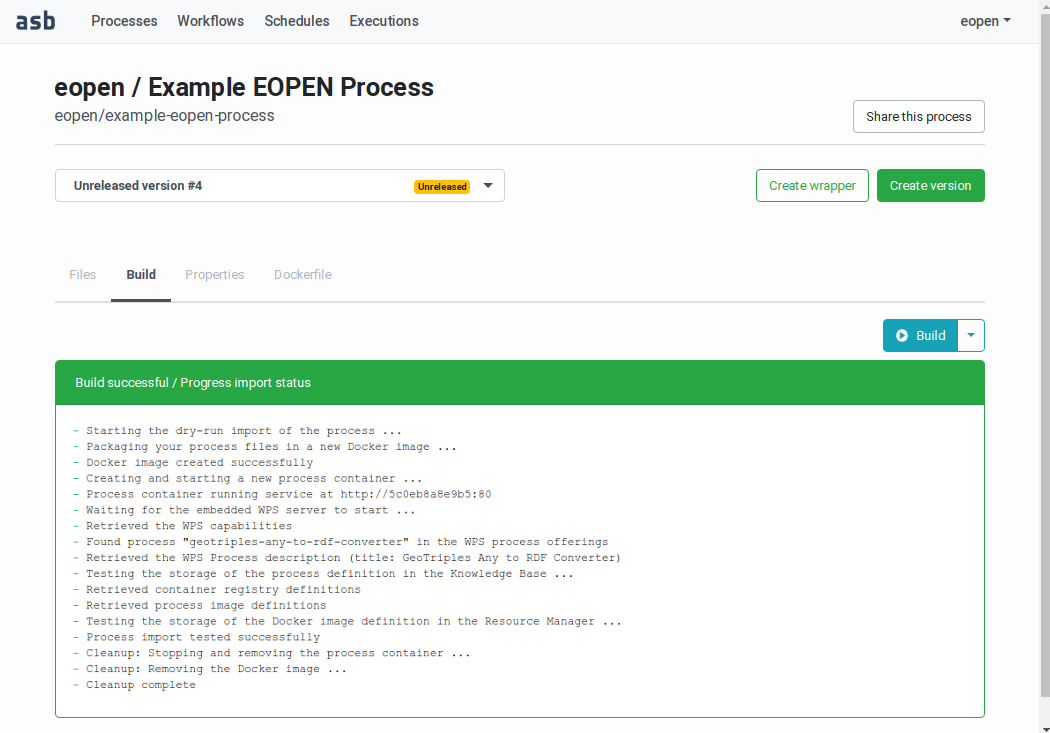
Figure 52 Building a Process Version (successful build)
Releasing a Process Version
A process version with a valid wrapper script and which successfully passed the build and release dry‑run is “Releasable”. At this time, it is still possible to upload new implementation files (or new versions of existing implementation files). Doing so “downgrades” the process version status back to “Buildable” as a new dry‑run is necessary to ensure the process version and its implementation files are valid.
To release a new process version, navigate to the related Process Management page, select the version to release in the drop‑down list then click on the “Build” tab.
The “Build” tab contains a Build button and an associated menu, as shown on Figure 53. Expand the menu and select the Build & Release entry. A build is started again and if successful the process version is imported and registered in the platform. Its status becomes “Released” and from now on it is not possible anymore to modify its implementation files.
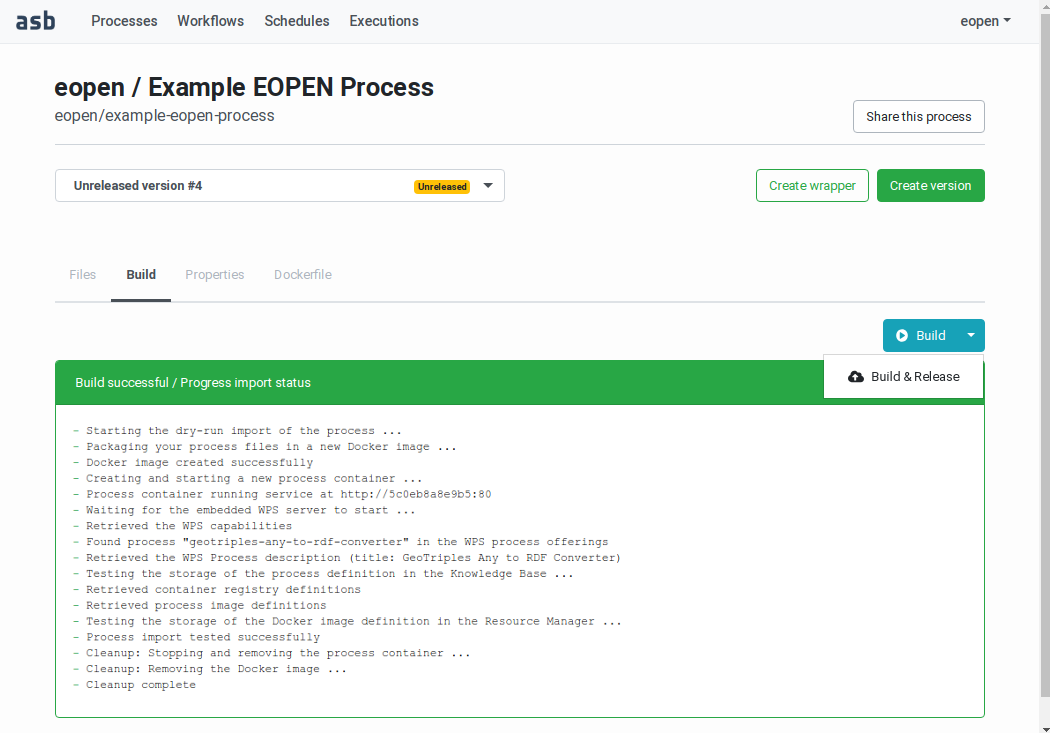
Figure 53 Releasing a Process Version
Once release, a process version may be selected and integrated in
processing Workflows, as described in Workflow Editing, below.
Process Sharing
By default, a Process is only visible and usable by its owner, that is, the user who created it.
In order to share a Process with other platform users, this must be added in a workspace accessible by these users (that is, a workspace in which they have a role).
In the following example, user “eopen” wants to share his Process “Example EOPEN Process” with the users who are given access to workspace “EOPEN”.
As can be seen on Figure 54, the process is not yet assigned to any workspace. To do this, click on the Share the process button. A popup dialog box appears. This allows selecting the workspace(s) the process must be assigned to. Workspaces must be selected in a drop‑down list. Once selected, a workspace may be removed by clicking on its “X” icon. The sequence of operations is depicted in Figure 55.
Figure 54 Process Management Page
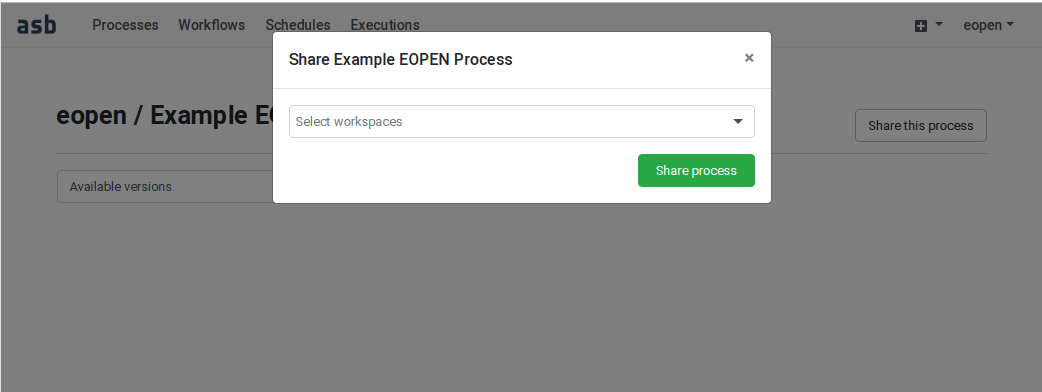
Figure 55 Process Sharing Operations
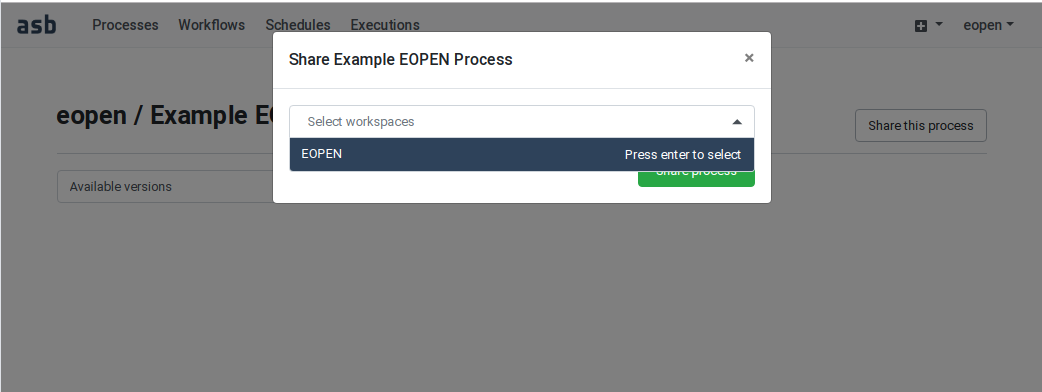
Figure 56 Process Sharing Operations
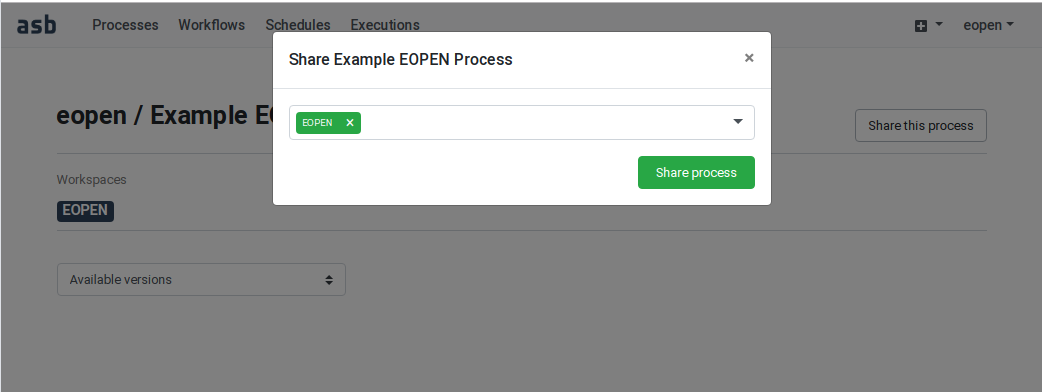
Figure 57 Process Sharing Operations
Process Implementation Guidelines
The following sections provide hints and guidelines for implementing processes. The tool for building new process versions is not currently verbose in describing what is causing an error during the actual import operations. The guidelines also helps indicating what could have been wrong in case of error.
Testing Processes Off‑line
The import mechanism (during the dry‑run and the actual import) includes the generation of a Docker image, the instantiation and execution of an instance of it (as a container), and the verification that the imported process is present in the offerings on the embedded OGC WPS service. This requires the process_wrapper.py file to be imported and parsed by the Python interpreter. If the Process Import Tool complains that the process cannot be found, the most probable cause is that the process wrapper file could not be imported. This may be due to a syntax issue (such as invalid indentation), or the import of a missing library or module.
It is thus advised, in order to prevent most of the errors that may occur at import time, to at first try to import and execute (if the dependencies are available), the wrapper code locally, in a controlled environment.
Example of local execution:
Python 3.7.7 (default, Apr 23 2020, 14:43:26)
[GCC 8.3.0] on linux
Type "help", "copyright", "credits" or "license" for more information.
>>> from process_wrapper import execute
>>> execute('/tmp', 'ignored')
{'events': {u'events': []}}
All Input Parameters are Strings
The Process Import Tool requires each input and output parameter to be associated to a data type. This data type is used by the platform to verify whether the inter‑connected parameters in the workflows are compatible or not. For example, the Workflow Editor will allow connecting two parameters of the same type (object, string, date, etc.) or an output of type string with an input of type object (as a string is an object), but not an output of type object with an input of type string (as an object is not necessarily a string).
In case of doubt, selecting “User String” is a safe default choice.
The data type of the process parameters is however not used in the processes themselves. Concretely, all the inputs to the execute(…) function in the process wrapper module are passed as strings.
It is up to the developer to convert (in a safe manner) the input values to their expected datatype.
# Testing the type of a variable
value_type = type(any_value)
# Convert string to integer
int_value = int(string_value)
# Convert string value to float
float_value = float(string_value)
# Convert any Python structure (including arrays and dictionaries)
# Note: this is potentially dangerous at string_value is interpreted
parsed_value = eval(string_value)
Importing Python Libraries
The process wrapper module may require additional libraries and modules to be imported depending on the processing needs. As the Python language permits it, the import statements may be added either in the main context (i.e. at the top of the file according to the official recommendations), or within code blocs.
Importing at the top of the file permits to verify that the imported element (library, module, function, etc.) is indeed available within the Docker image. If the import statement is located, for example, within the execute(…) function, this will not be evaluated at process import time but when the process will be deployed and executed during a workflow execution. In this case potentially missing dependencies will be detected at execution time instead of process import time.
Importing and Using GDAL Libraries
Note about GDAL libraries: in the recent versions of the GDAL Python bindings, direct import of the GDAL libraries has been removed. This is shortly explained here: https://pypi.org/project/GDAL/. As of writing this guide, GDAL version 2.4.0 is installed when the dependency is selected in the Process Import Tool.
The following code fragment shows the proper way to import GDAL libraries that is through the osgeo package:
# Before:
#import gdal
#from gdalconst import *
#from osgeo import osr
# Now:
from osgeo import gdal
from osgeo.gdalconst import *
from osgeo import osr
Using SNAP 7 Tools GPT and Snappy
In this second EOPEN platform prototype the version of the Sentinel Application Platform SNAP (https://step.esa.int/main/toolboxes/snap/) has been upgraded from version 6 to version 7. This release uses a new version of the Java virtual machine that has better compliancy with the containerisation technology.
The version of SNAP available at the time this document has been produced is 7.0.0 (22.07.2019 13:30 UTC) originating from: https://step.esa.int/main/download/snap-download/
To use SNAP 7 in a process, select SNAP Sentinel‑1/2/3 Toolbox v7.0 + Snappy as Main Dependency in the Process Wrapper Script Generation page. This translates into the following entry in the wrapper script:
Main Dependency:
snap_sen_tbx-7.0
The use of GPT and Snappy in SNAP version 7 remains unchanged compared
to version 6.0. An example process wrapper script that uses GPT is
provided in Appendix %s.
Use GPU Capabilities
To run a process that beneficiates from GPU hardware, you need to do the following:
Release your process version by indicating the number of GPUs required for your algorithm
At runtime tag your workflow processes with a gpu-enabled worker
Release your process version with GPU enabled
In the wrapper generator or directly in your wrapper script include the following line under Processing Resources:
gpu -- 1
This indicates that your process version requires 1 GPU. Note that GPU are integer resources, this means that you should never put a floating point for GPU resources. If a floating value is provided, the wrapper parsing will fail.
Flag your workflow processes
In the workflow tag the processes, as described in Worker Selectors,
that require GPU with a gpu-enabled worker.
For example use the YODA Worker (GPU) selector to run your processes on SpaceApps’ GPU-enabled worker.
Using the Local Folder
The files that are imported via the Process Import Tool are located in folder /asb/user in the Docker images. This is not the working folder of the Python interpreter that runs the OGC WPS service which means trying to access a local file from a Python script without providing at least a path fragment will not work.
For example, consider a file settings.json uploaded together with process_wrapper.py and loaded by the latter. The following code will fail because the JSON file cannot be found:
# Read process settings from JSON file
with open('settings.json') as settings_file:
    data = json.load(settings_file)
The following error is raised at execution time:
IOError: [Errno 2] No such file or directory: 'settings.json'
The absolute path to the file must be included, as follows:
# Read process settings from JSON file
with open('/asb/user/settings.json') as settings_file:
    data = json.load(settings_file)
Using the out_dir Folder
The execute(…) function defined in each process wrapper receives an out_dir parameter. For example:
def execute(out_dir, startdate, enddate, writelogfile='False'):
  pass
This parameter is given the absolute path to the folder whose content is persisted after the completion of the process. Any file or folder located outside this folder will be lost.
out_dir must be used to save the files that are needed by the processes connected downstream in the workflow. In that case, the process that stores a file must output its path (and file name as appropriate) and pass this value to the next processes through connected parameters.
Please note that the path is edited automatically and is not the same inside and outside the processes execution environment. It is thus important to pass them through output/input parameter connections.
Files stored in out_dir are accessible by the users after the completion
of the related workflow through the Execution Report page, as explained
in Workflow Execution Report.
Importing a Folder Hierarchy
As explained in Using the Local Folder all the files
imported using the Web interface of the Process Import Tool are located
in the same folder in the generated Docker image. Archive files (tar and tar.gz files) may
also be uploaded for importing a big amount of files or a folder
hierarchy as these are automatically unpacked in the generated Docker
images.
For example, importing a tar file with the following content:
appfiles/__init__.py
appfiles/utils.py
allows importing the appfiles/utils.py module in a process wrapper as follows:
# Importing the whole utils module
from appfiles import utils
# Importing a particular function
From appfiles.utils import utility_function
This mechanism is not limited to Python packages. Any files required by the process may be included in the Docker image using tar file.
Installing additional Python Packages
Python packages that are not available in the proposed software dependencies may be installed on‑demand in the process Docker images by using the standard “pip” tool (https://pip.pypa.io/) and a “requirements.txt” file. This mechanism is automatic. If a file named requirements.txt is uploaded with the process version implementation files, the pip tool is executed and the file is provided as input.
The requirements.txt file is a text file that specifies the name of a Python package per line. Constraints may be expressed to force a given version of a package to be installed.
Note: As explained in Testing Processes Off‑line,
it is good practice to test a process off‑line at first.
This allows to save a lot of time,
especially when the process build and import fails for simple mistakes.
It is thus also advised to test your requirements.txt
file off-line by executing pip locally as follows:
pip install –r requirements.txt
Example requirements.txt file:
# For development
#ipython==3.1.0

# Django
djangorestframework==3.3.3
django-autocomplete-light>=2.0,<3.0
django-rest-swagger==0.3.7
The syntax of the requirements.txt file is fully described in the pip user guide: https://pip.pypa.io/en/stable/user_guide/#requirements-files.
Using the Python Logger
The Python logging module is configured to store in a file the log traces generated by the process modules. Each executed process generates a log file that is made available in the corresponding logs folder accessible through the Execution Report pages.
By default, the logging level is set to DEBUG. This may be changed programmatically as shown in the example, below.
Use the Python logger in the usual manner, as follows:
import logging
logger = logging.getLogger(__name__)
# Change the loggging level, if necessary
logger.setLevel(logging.DEBUG).
# Log info, warning, error, debug messages
logger.info('Execution started')
logger.warning('Something may be wrong')
logger.error('Something went wrong')
logger.debug('Received the following data from the service: %s', data)
Should it be necessary, the advanced functions of the logging module may be used as described in the Python documentation: https://docs.python.org/3/library/logging.html.
Main versus Software Dependencies
The Process Wrapper Template Generator page of the Process Import Tool allows selecting a Main Dependency as well as a number of Software Dependencies. Because the software dependencies are installed in the Docker images at the process import time, the complete operation may last several minutes. And the more individual software dependencies are selected, the longer is the Docker image building step.
To mitigate this, a number of “main dependencies” are proposed. Each of these correspond to a pre‑built Docker image that already contains a number of software packages and that may be used as parent for the process image.
For example, selecting the “SNAP Sentinel‑1/2/3 Toolbox v7.0 + Snappy” image allows saving the time to download, install and update the SNAP software in the process image. The same applies to the “R interpreter and libraries” image which already contains all the tools necessary for executing R scripts.
Workflows Management
Selecting the Workflows tab in the header leads you to the Workflows
Management page. As shown on Figure 58, the page shows
in a table your own workflows as well as the workflows you are allowed
to access, depending on the workspaces configuration (as explained in
Workflow Sharing).
An input field located above the table allows filtering the workflows. Next to it, a New workflow button allows creating a new workflow (as described in the next section).
Each row in the table includes the following elements:
The owner (creator) of the workflow
The workflow name
An Edit Workflow button leading to the Workflow Editor (see
Workflow Editing)A Schedule button for configuring unattended execution(s) in the future (see
Workflow Executions Scheduling)A Execute button for initiating an on‑demand (immediate) execution (see
Workflow On‑Demand Execution)
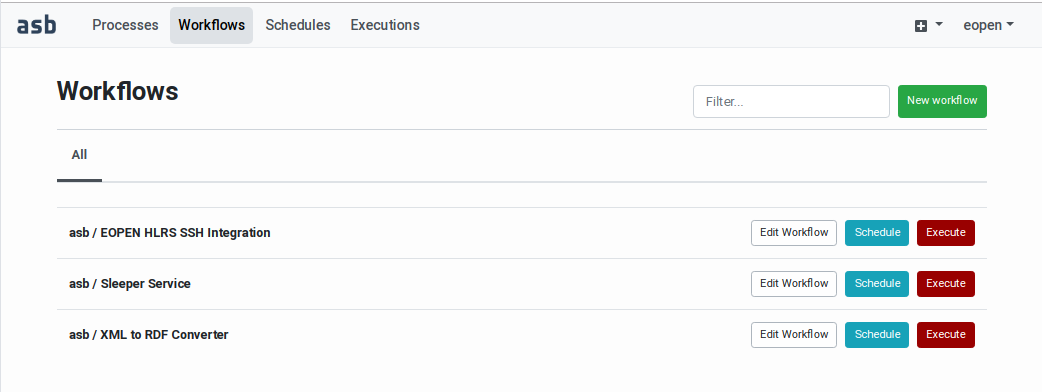
Figure 58 Workflows Management Page
Creation of a New Workflow
Clicking on the New workflow button reveals a popup dialog box which asks for the name of the new workflow (see Figure 59). The workflow name is a free text that will be used to identify the workflow in the user interface. At the same time the name is entered, a “slugified” version of it is generated automatically and displayed in a second input field. It is in principle not necessary to edit this generated identifier but should it be necessary, care must be taken to enter an identifier that only contains lowercase characters, dashes and digits.
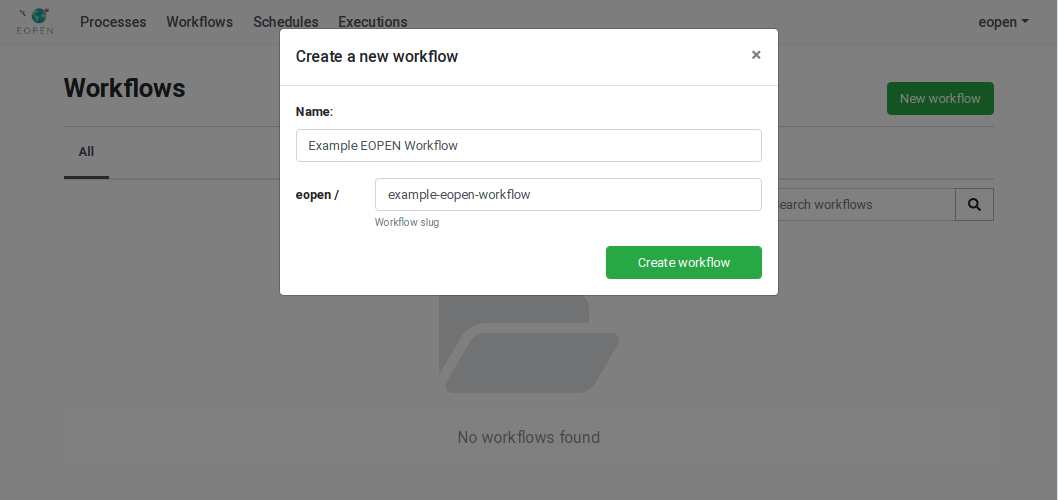
Figure 59 Creation of a new Workflow
Enter the requested information then click on the Create workflow button. You are automatically redirected to the Workflow Management Page (see Figure 60).
On the screen, the workflow name is always prefixed with the name of its owner (creator).
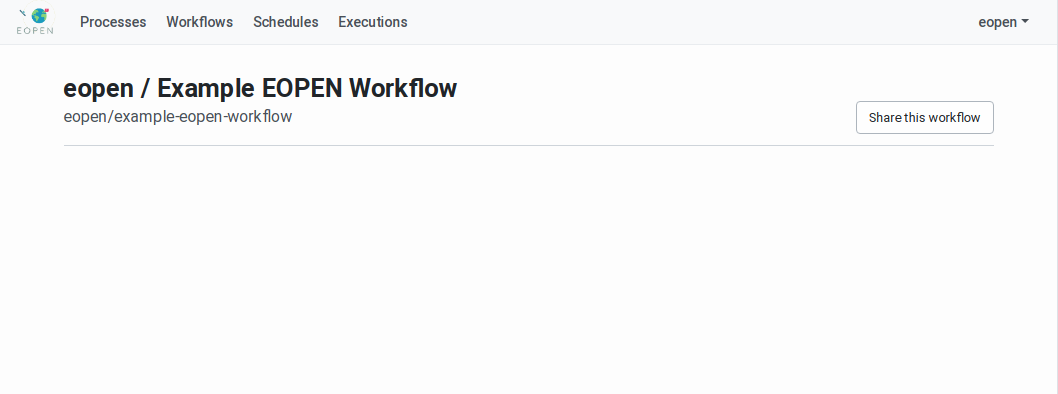
Figure 60 Workflow Management Page
Workflow Editing
Workflows created as described in the previous sections cannot be executed as they do not include any process yet. In order to configure a workflow, navigate to the Workflows Management Page, identify the workflow to be edited, then click on its associated Edit Workflow button. Doing so reveals the Workflow Editor, as shown on Figure 61.
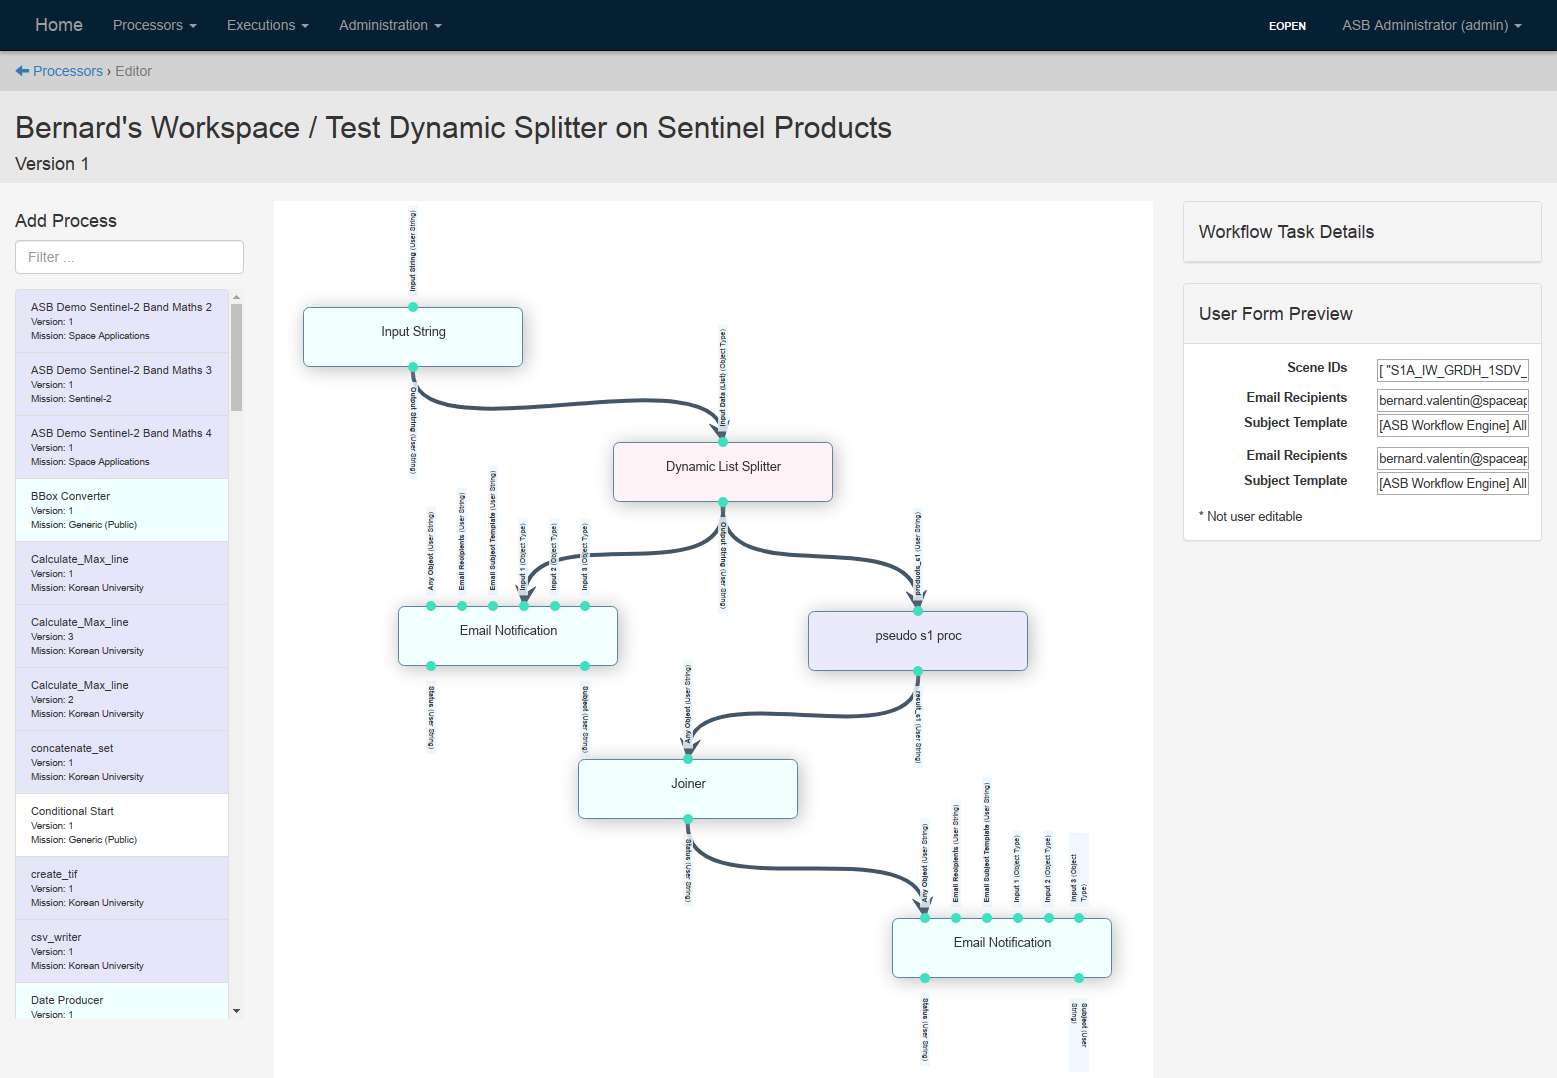
Figure 61 Workflow Editor
The Workflow Editor displays the following elements:
1 |
Workflow identifier and version |
2 |
Use this search box to filter the list of available processes |
3 |
List of available tasks and processes. A colour code is used to make a distinction between the tasks implemented as functions executed within the workflow engine, in light green, processes implemented as OGC WPS processes, in light blue, and tasks that have a special purpose such as the Splitter and the Joiner, in pink. Moving the mouse pointer on an entry in the process list reveals two icons:
|
4 |
Workflow design canvas. Selected processes appear in the upper-left corner of the canvas. Use the mouse to drag them to the appropriate location. The canvas height adapts automatically to show the full height of the workflow. Use the mouse to connect a process output parameter to the input parameter of another process. The editor verifies automatically whether the connected parameters are compatible, that is, if the output parameter data type is the same or a sub-type of the input parameter data type. If the parameters are not compatible, the editor displays an error and the connection is not realized. To remove a connection, use the mouse to drag the arrow end to a location in the canvas where there is not parameter to attach. To remove a process instance from the canvas, select this instance and click on the “x” icon located in its upper‑right corner. A confirmation is asked before proceeding with the actual deletion. The vertical arrangement of the processes has an impact on the user parameterization form: The form list the unconnected inputs according to the vertical position of the corresponding processes. Any change made in the canvas (process positioning, connection creation and removal) is automatically saved in the Knowledge Base. |
5 |
Process details panel showing the inputs/outputs of the selected process. Each process input parameter has a label, default value, visibility flag and “editability” flag configured in its generic definition. In the context of a specific workflow, or a specific instance of the process in a workflow, the default properties may not be appropriate.
Altered parameters are highlighted in pink. Click on the Save changes button to persist the changes. The User Form Preview is then updated to reflect the custom parameter properties. |
6 |
|
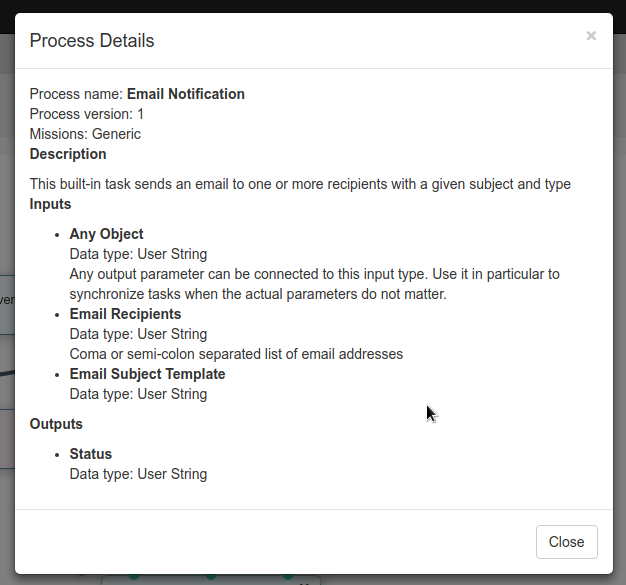
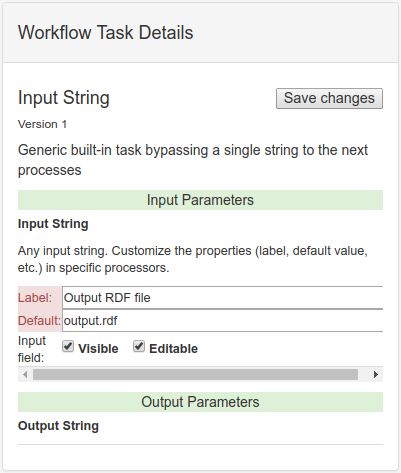
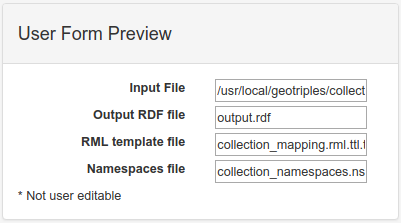
When the workflow is configured it may be executed manually using the Workflows Management Page. This is described in the next section.
Worker Selectors
Worker Selectors is a mechanism enabling users to put constraints on the deployment environment. Worker Selectors enable users to constraints the processes to run on specific workers, or workers that meet user requirements.
Figure 62 shows a workflow with a process named Health Check tagged with one worker selector YODA Worker (GPU). This process will be forced to be deployed on the worker named YODA and will be able to use its GPU capabilities.
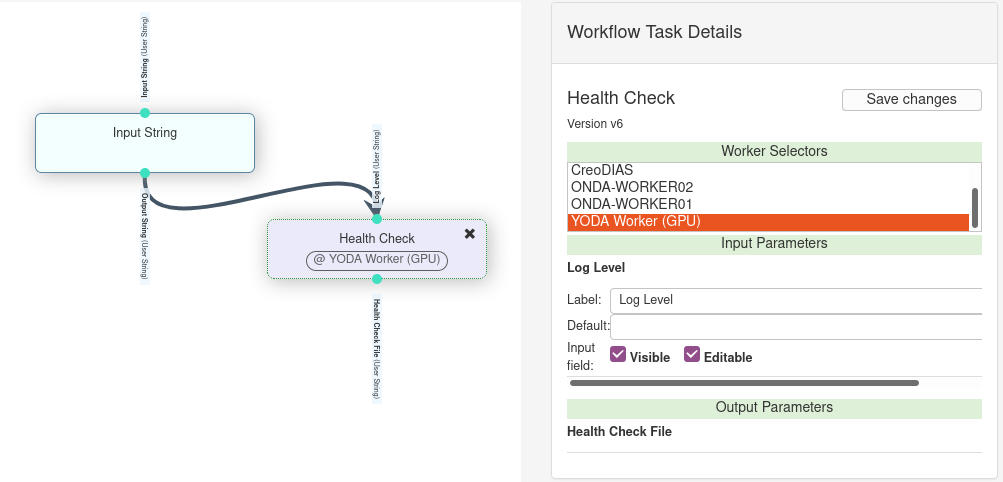
Figure 62 Workflow with a process tagged with a Worker Selector
To tag your processes with a worker selector, click on a process in the workflow editor. On the right, a list of worker selectors appears, as shown on Figure 62. Click on the worker selectors to be applied. To select multiple entries, hold CTRL while clicking. Click on “Save changes”: the selectors are now visible under the process name in the workflow.
Workflow Configuration Guidelines
The EOPEN Platform comes with built‑in functions that may be integrated in the workflows to obtain specific behaviours. Functions and processes are selected and integrated within workflows in exactly the same manner. The only visible difference in the editor is the background colour: functions are coloured in light blue and processes in light purple.
The following sections describe the purpose of the built‑in functions and provide hint for their usage.
Inputs De‑duplication using Pass‑Through
The workflow parameterisation forms are dynamically generated and contain an input field for each input parameter in the workflow graph that:
is not connected to an output parameter of an upstream function or process
and is not configured as hidden (i.e. un‑checking the Visible flags in the workflow editor).
If the workflow contains several processes that expect the same value, this leads to a parameterisation form in which the user will have to provide the same value several times. To avoid this situation, “pass‑through” built‑in functions may be used to pass without modification the value given to their unique input parameter to one or more functions or processes connected downstream.
In the following example two sample processes receive a latitude and a longitude value. If the two processes are not receiving their inputs from upstream elements, the parameterization form will include four inputs, as depicted on Figure 63. If, for any reason, the two sample processes must be applied on the same latitude value, it is neither safe nor handy to ask the user to provide the same value twice in the form. In this case, it is preferred to add a pass‑through function (of type integer in this example) that allows giving the same value to the two input parameters. The result, as shown on Figure 65, is a parameterization form with only three input fields which guarantees the only latitude value will be received by the two processes connected downstream.
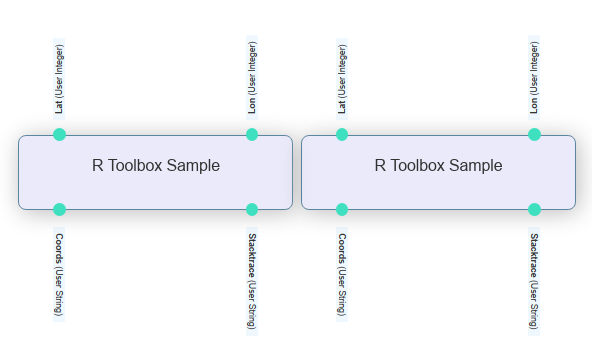
Figure 63 Workflow and parameterization form with duplicated
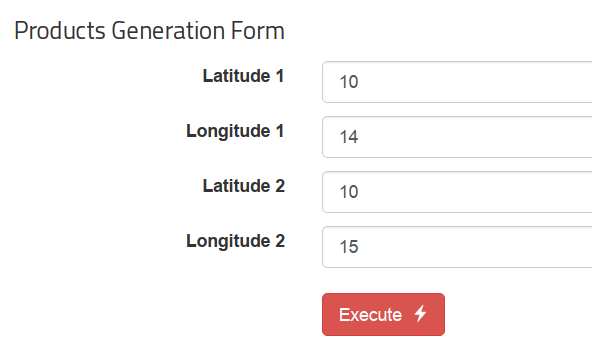
Figure 64 Workflow and parameterization form with duplicated “Latitude” fields
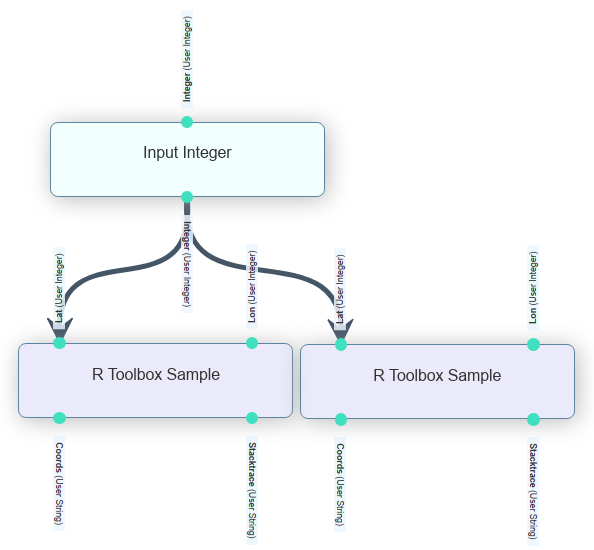
Figure 65 Workflow and parameterization form with de‑duplicated
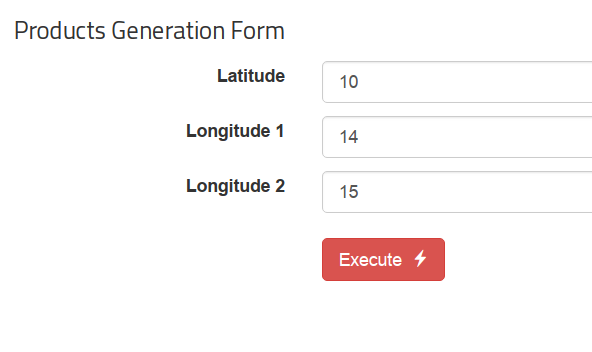
Figure 66 Workflow and parameterization form with de‑duplicated “Recipients” field
Value Producers (Generators)
Value producers are built‑in functions that generate values that depend on the execution time and context. For example, a generator function may be used to generate a date range that starts at some point in the past or the future (offset) and spans a given amount of days (duration).
This is particularly helpful when the execution of a workflow is scheduled at regular interval and at each execution a new date range must be processed.
Figure 67, below, shows an example of execution of a workflow that includes a Date Range Producer function for generating a date range dynamically. In the example, the execution occurs on May 11th, 2017. The generated date range covers the last 5 days (date offset = ‑6, date span = 5).
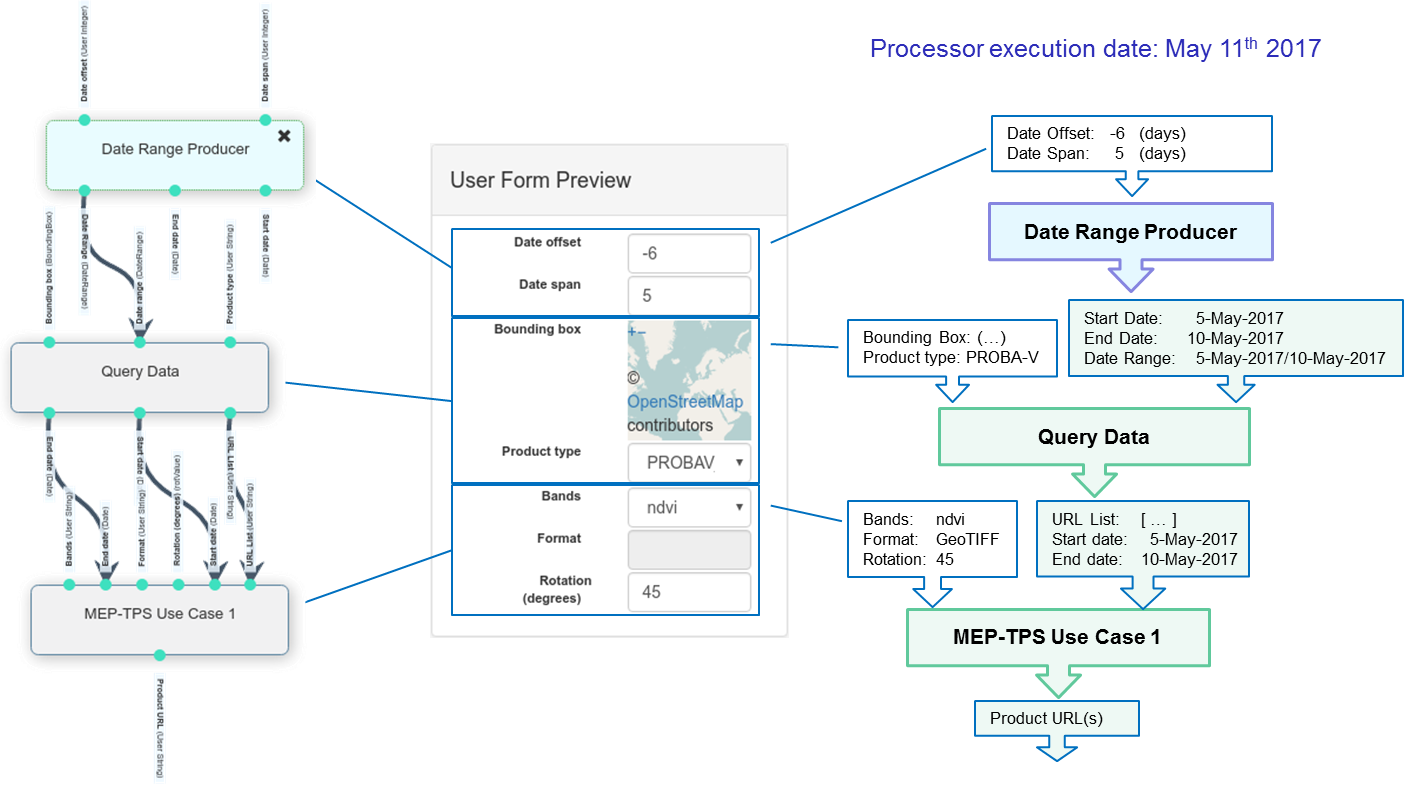
Figure 67 Example workflow execution including a Date Range Producer function
Comparators
A Comparator is a built-in workflow function that applies a comparison operator on two input values and outputs a value that indicates whether the comparison is True or False.
The comparison operator must be chosen within a list of allowed values which depends on the type of the inputs. Available string comparators are “equals”, “startswith”, “endswith” and “matches”.
The values to compare may come from an output of a process executed upstream or, if not connected, be provided manually via the workflow parameterization form. As usual, default values may also be provided in the workflows editor. The input values are passed through as outputs and can thus be further connected with downstream functions and processes.
In addition to the two output values that replicate the compared values, a “result” output indicates if the outcome of the comparison is True or False, and a “not_result” output indicates exactly the opposite.
Conditional Branching
A workflow branch that must be executed conditionally must be connected downstream a Conditional Start function. This function receives an “execute” parameter which, when given the value “False” provokes the downstream functions and processes to be skipped (without producing an error).
Because the skip/no‑skip decision is controlled by a “stringified” boolean value (“True” or “False”) it may be necessary to connect that input parameter to a Comparator function upstream to implement the following scenario:
Use the Comparator to verify, for example, that a string matches a regular expression and output the comparison result as a boolean value.
Connect a Conditional Start after the Comparator to execute the workflow branch only if the comparison is positive.
The example workflow fragment represented in Figure 68 applies this scenario.
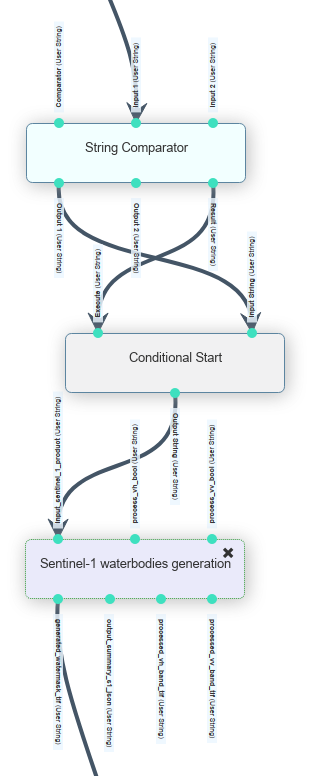
Figure 68 Example conditional workflow fragment
At execution time, the String Comparator receives the following inputs:
Input 1: “S1A_IW_GRDH_1SDV_20190401T051844_20190401T051909_026592_02FB56_1AF1”
Comparator: “matches”
Input 2: “.*S1.*”
Because Input 1 matches the regular expression provided in Input 2, the function outputs the value “True” that is communicated to the Conditional Start function.
In this example, the Conditional Start function receives the following inputs (all values received from the Comparator):
Input String: “S1A_IW_GRDH_1SDV_20190401T051844_20190401T051909_026592_02FB56_1AF1”
Execute: “True”
Because the Execute parameter receives “True”, the function outputs the value of Input String and the execution flow continues to the next process.
The Sentinel‑1 waterbodies generation process receives the scene ID as input.
Comparator and Conditional Start functions may be included in different places in a workflow to implement conditional branching in parallel fragments.
Functions and Processes that have been skipped during the execution of a workflow are coloured in pink in the Execution Report pages, as exemplified in Figure 69, below.
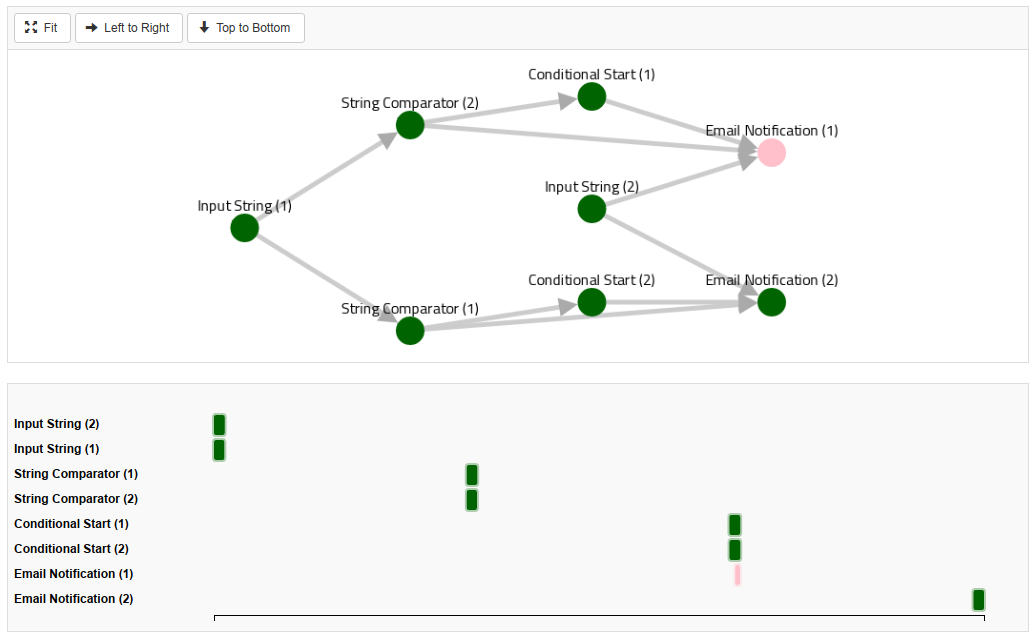
Figure 69 Example skipped process in an Execution Report
In order to limit the propagation of the skipped functions and processes downstream, a Conditional End function is also available. This is in particular useful when two or more branches which are executed conditionally join again after the conditional fragments.
Figure 70 shows the schema of a workflow that uses Conditional Start and Conditional End to execute workflow fragments (represented by Process B1 and Process B2) conditionally but still pursuing the execution afterwards (Process C).
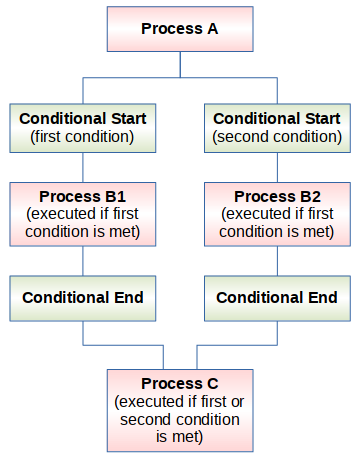
Figure 70 Workflow graph with bound conditional branches
Parallel Processing using a Dynamic List
The Dynamic List Splitter built‑in function provides a means for executing a series of tasks on every element of a list, independently and simultaneously, up to the limits of the processing resources.
The Splitter must receive a JSON array through its only input parameter. It has a single output which represents an entry of the array that must be connected to the workflow fragment to be parallelised.
At the other end of the “parallelisable” workflow fragment, a Joiner function must be inserted to act as a synchronisation point: it waits for all the workflow fragment instances to be completed before scheduling its downstream processes.
To benefit from this feature at execution time, it is thus necessary to
build the workflow appropriately. Figure 71 represents
a workflow being edited in the Workflow Editor. See Workflow Editing for a general
description of the Editor.
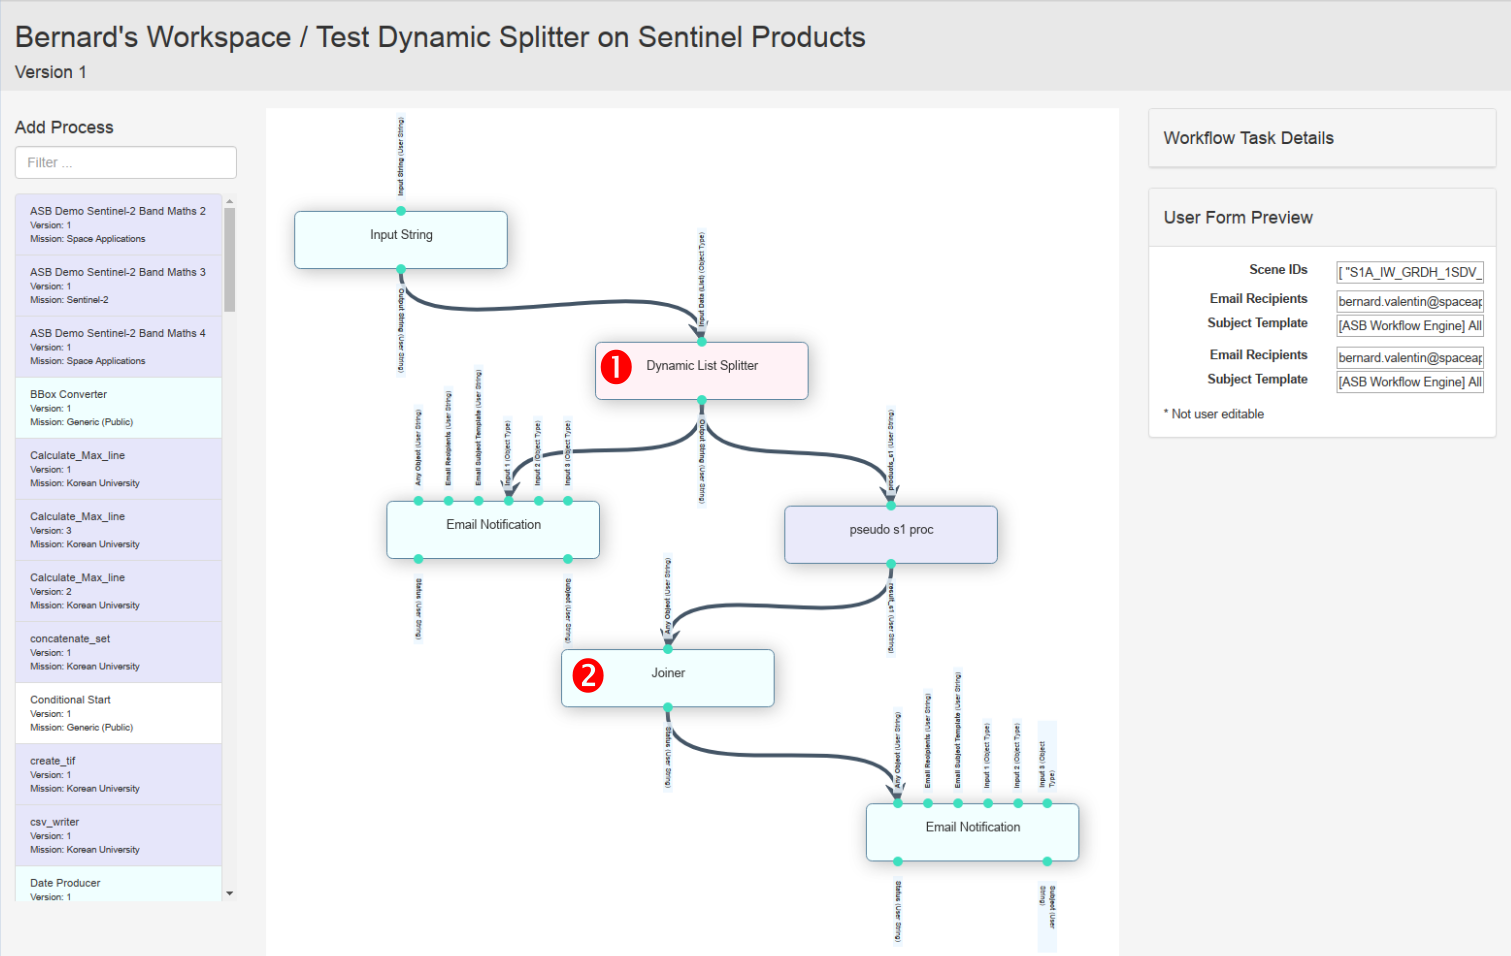
Figure 71 Workflow Editor
To create a parallelisable workflow fragment, create a workflow as represented in Figure 71:
Insert in the canvas the processes to be executed before the split and connect them appropriately.
One of the above processes must output a list of strings. Add the Dynamic List Splitter process in the canvas (see 1 in the figure) and connect the process output parameter to the splitter input parameter.
Insert the processes to be executed for each entry in the list and connect them appropriately.
Connect the Dynamic List Splitter only output parameter to the process input parameter that must receive the list entry to be processed.
Add the Joiner process (see 2 in the figure) and connect its output of the last process to its only input.
Insert the processes to be executed after the parallelized workflow fragment and connect them appropriately. The first of these processes must be connected to the Joiner only output parameter.
The workflow must comply with the following rules to be valid:
A workflow may only contain one pair of Splitter / Joiner functions.
No other connection than the one traversing the Splitter process are allowed between the processes located before and after the Splitter process. The example on the left side of Figure 72 is thus invalid and will not be executed successfully. The faulty connection is identified with the interdiction icon.
No other connection than the one traversing the Joiner process are allowed between the processed located before and after the Joiner process. The example on the right side of Figure 72 is thus invalid and will not be executed successfully. The faulty connection is identified with the interdiction icon.
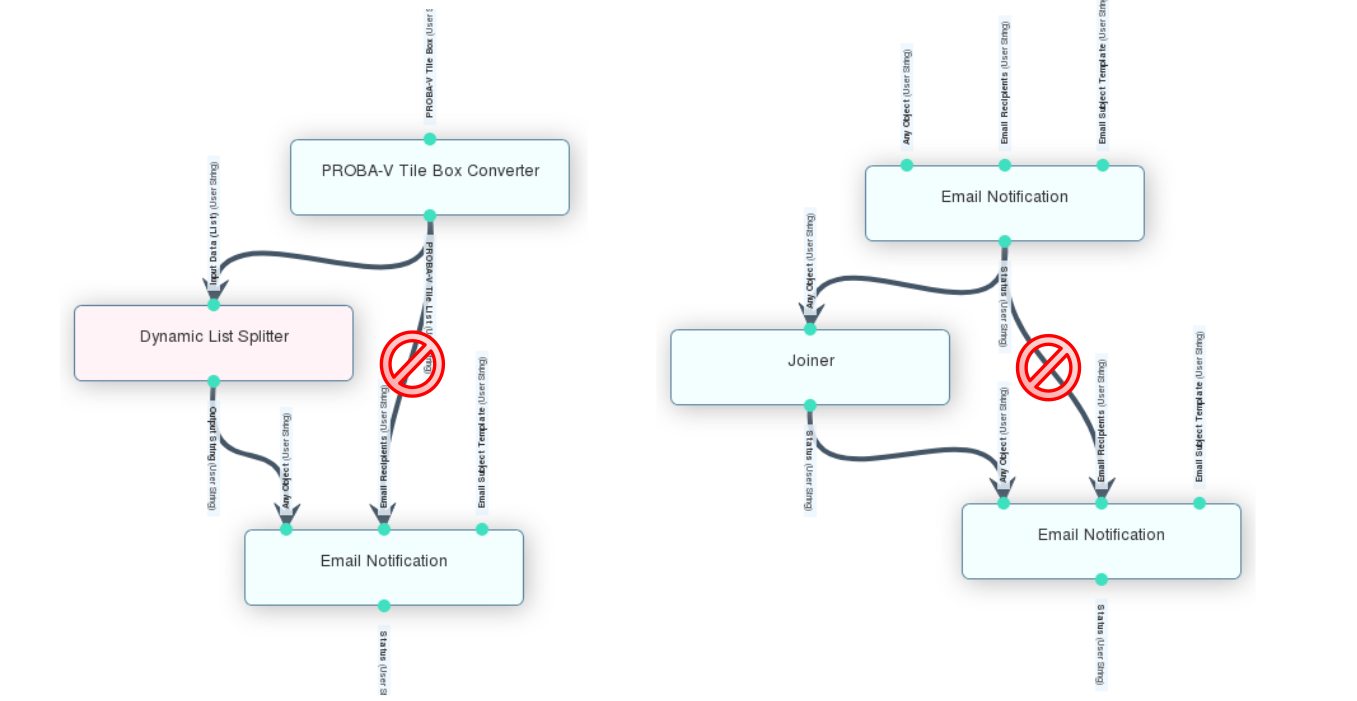
Figure 72 Examples of Invalid Connections when using Splitter and Joiner functions
When the execution of such a workflow is complete, the Execution Report page displays information about the multiple execution of the workflow fragment. In particular in the “Execution Time and Status” section:
The graphical version of the workflow represents each workflow fragment execution as a separate process whose label is the processed item.
Similarly, the Gantt chart lists the workflow fragment executions as processes and shows their start and end time on the timeline. Note: The Joiner appears to start shortly after each workflow fragment. It is actually the case as its role is to wait for all the executions to be completed before passing the execution flow to its downstream processes.
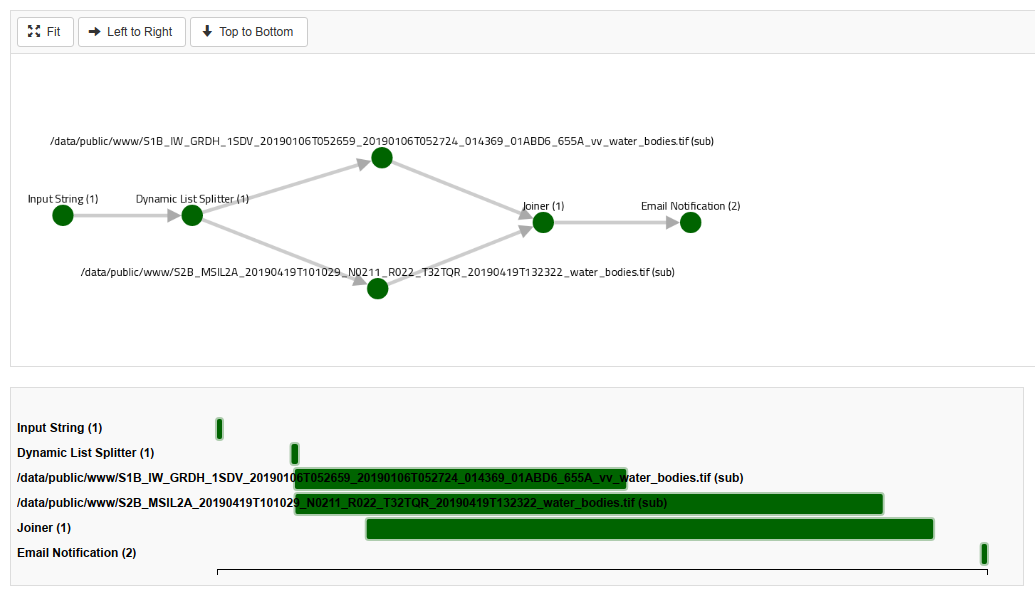
Data files generated within the parallelized workflow fragments are available in the datastore within folder with a “_child” suffix.
Email Notifications
The “Email Notification” built‑in function allows sending emails to selected recipients at different steps of the execution of a workflow. As the function may be connected after any other function or process in a workflow it is mostly used to announce the completion of a processing and if applicable the availability of new products. This is however not a limitation.
Note that the subject of the emails is customizable but not their body.
The input parameters allow specifying the list of recipients and customizing the subject of the message:
Any: Connect any output parameter to this input parameter allows to control at what time in the processing chain the notification must be issued. This is usually not needed as in general connecting to one or more of the “Input Object” parameters (see below) is sufficient.
Recipients: The comma or semicolon-separated list of email addresses the notification must be sent to.
Subject Template: A one‑line string that will be used to generate the email subject. The stringified version of one or more of the “Input Object” parameters may be included using the <1> notation where the digit is the number of the input. Use the <input:begin:end> notation to insert a substring of an input value (e.g. <1:17:32> inserts the substring between position 17 and 32 from input 1).
Input Object 1, 2 and 3: Values given to these parameters (or a substring of these) may be included in the email subject using the template string given to the “Subject Template” parameter. They are also inserted in full in the email body as shown in the example below. These parameters are generally used to give information about the products that have just be generated (name and other attributes).
The function produces the following output parameters:
Email Subject: The email subject string as generated using the subject template and the input object values.
Status: The string “success”. If something goes wrong in the function, the workflow fails.
Example email generated by this function:
Subject (on a single line):
[EOPEN] New Layer Published:
S1B_IW_GRDH_1SDV_20190106T052659_20190106T052724_014369_01ABD6_655A_vv_water_bodies
Message:
Notification Type: Default
Dag ID: 2019_05_08_16_03_00_973273z_publish_geotiff_example_child
Dag Run Owner: asb/admin
Execution date and time: 2019-05-08 16:05:33.168545+00:00
Start date and time: 2019-05-08 16:05:33.438319+00:00
Notification data:
• S1B_IW_GRDH_1SDV_20190106T052659_20190106T052724_014369_01ABD6_655A_vv_water_bodies
Mattermost Notifications
The Mattermost Notification built‑in function allows issuing a message through a Mattermost channel. All the users registered on that channel will instantly receive the notification. This allows, for example, sending updates when a product has become available or alerts when an event has been detected.
At execution time, the function issues an HTTP request to the Mattermost application. The HTTP end‑point must be configured as an Incoming WebHook. Instructions for configuring and using Incoming WebHooks in Mattermost may be found in the following Web pages:
https://docs.mattermost.com/developer/webhooks-incoming.html
https://developers.mattermost.com/integrate/incoming-webhooks/
The text of the message is built using a template string similarly to the email subjects described in the previous section.
The Mattermost Notification function takes the following input parameters:
Any Object: Connect any output parameter to this input parameter allows to control at what time in the processing chain the notification must be issued. This is usually not needed as in general connecting to one or more of the “Input Object” parameters (see below) is sufficient.
WebHook URL: The end‑point URL of the Incoming WebHook configured in Mattermost. For example: http://<domain-or-ip>:<port>/hooks/xxxbfij1wphfdyp56stdjr52hh
Channel: The Mattermost channel on which the message must be posted.The following channels exist in the EOPEN Platform prototype: flood-events, snow-cover and food-security.
Message Template: A one‑line string that will be used to generate the notification message. The stringified version of one or more of the “Input Object” parameters may be included using the <1> notation where the digit is the number of the input. Use the <input:begin:end> notation to insert a substring of an input value (e.g. <1:17:32> inserts the substring between position 17 and 32 from input 1).
Input Object 1, 2 and 3: Values given to these parameters (or a substring of these) may be included in the notification message using the template string given to the “Message Template” parameter.
The function outputs the Response of the HTTP request, which should be “OK” and a Success boolean “True” or “False”.
Publish Geospatial Data in GeoServer
The Publish on GeoServer process allows publishing GeoTIFF and Shapefile products as layers in a GeoServer instance. The process creates a new Store and a new Layer using the geospatial data file, the name and the style given as input parameters.
The behaviour of the process can be configured using two input flags:
Setting fail_on_geoserver_error and overwrite_if_exists inputs to True will automatically overwrite the layer with the same name if it exists.
Setting fail_on_geoserver_error and overwrite_if_exists inputs to False will publish the new layer only if it does not already exist. If it already exists, the new layer will not be published and no error will be reported.
The input parameters that must be provided to the process are the following:
GeoServer URL: Base URL of GeoServer instance. Example: http://192.168.1.1:8080/geoserver
GeoServer Workspace: GeoServer Workspace in which the store and layer must be created. The workspace must already exist in GeoServer.The workspace “EOPEN” must be used in the EOPEN platform.
Path to data file: Filepath of the GeoTIFF or Shapefile file to publish. The file must be accessible to GeoServer through one of the following folders: auxiliary or public. Example: /data/public/www/S2B_MSIL2A_20190419T101029_20190419T132322_water_bodies.tif /data/public/www/S2B_MSIL2A_20190906T101029_N0213_R022_T32TQR_water_bodies.shp
Tags to apply on the layer: Coma-separated list of tags / keywords to store with the new layer. This helps filtering and searching for layers with GIS clients that support them.
Style: Style available in GeoServer to be applied to the new layer. Format: “<Workspace>:<Style>”. Example: EOPEN:WaterBodies
Fail on GeoServer Error: If True, an error will be raised if GeoServer returns a status code >= 300. Possible values are True and False.
Overwrite If Exists: If True, the process will remove layer and store corresponding to the name input, if they exist. Possible values are True and False.
The process outputs the following information:
GeoServer Store: Name of the created store. This is the base name of the input file.
GeoServer Layer: Name of the created layer. This is the base name of the input file.
Generic Template Renderer
The Template Renderer function allows generating any piece of text using an input template and the data to insert in the template. The template text must comply with the Jinja2 syntax, see: https://palletsprojects.com/p/jinja/.
The function may be used to convert, crop, or concatenate strings, for example between processes that do not use the same string structures.
For example:
to append an time to an ISO data: 2019-12-24 => 2019-12-24T00:00:00
to crop a string: 2019‑12‑24T12:43:23Z => 2019-12-24
It may also be used to generate a text to be stored in an output file or
sent through a communication channel such as emails (see Email Notifications)
and Mattermost (see Mattermost Notifications).
The following operational workflow executes the event detection in tweets data process then generates two texts: the first one is sent by email while the second one is sent through Mattermost.
When executed, the following data flows through the graph (note: line breaks have been added to increase the readability):
The output of the Event Detection process is a Python dictionary:
 {u'events': [
    {u'useCase': u'EnglishFloods', u'score': 1.56,
    u'epoch_timestamp': 1578133493565, u'change': u'91%'},
    {u'useCase': u'EnglishFood', u'score': 0.32,
    u'epoch_timestamp': 1578133497885, u'change': u'-19%'},
    {u'useCase': u'EnglishSnow', u'score': 0.58,
    u'epoch_timestamp': 1578133501892, u'change': u'-34%'},
    {u'useCase': u'FinnishSnow', u'score': 0.43,
    u'epoch_timestamp': 1578133505873, u'change': u'26%'},
    {u'useCase': u'GreekFloods', u'score': 0.94,
    u'epoch_timestamp': 1578133509851, u'change': u'112%'},
    {u'useCase': u'GreekSnow', u'score': 0.23,
    u'epoch_timestamp': 1578133513829, u'change': u'-48%'},
    {u'useCase': u'ItalianFloods', u'score': 0.2,
    u'epoch_timestamp': 1578133517814, u'change': u'-43%'},
    {u'useCase': u'KoreanFood', u'score': 0.26,
    u'epoch_timestamp': 1578133521795, u'change': u'-100%'}
   ]
}
The Template Renderer function on the left receives the Python dictionary and a Jinja2 template for rendering the data into a fragment of HTML document. This document will then be sent by email to selected recipients.
Jinja2 template:
Detected events<br/><ul>{% for event in input1.events %}
<li><b>{{event.useCase}}</b>: score={{event.score}},
time={{datetime.fromtimestamp(event.epoch_timestamp/1000.0).strftime('%Y-%m-%d
%H:%M:%S')}}, change={{event.change}}
</li>{% endfor %}</ul>
Generated HTML document fragment:
Detected events<br/><ul>
<li><b>EnglishFloods</b>: score=1.56, time=2020-01-04 11:24:53,
change=91%</li>
<li><b>EnglishFood</b>: score=0.32, time=2020-01-04 11:24:57,
change=-19%</li>
<li><b>EnglishSnow</b>: score=0.58, time=2020-01-04 11:25:01,
change=-34%</li>
<li><b>FinnishSnow</b>: score=0.43, time=2020-01-04 11:25:05,
change=26%</li>
<li><b>GreekFloods</b>: score=0.94, time=2020-01-04 11:25:09,
change=112%</li>
<li><b>GreekSnow</b>: score=0.23, time=2020-01-04 11:25:13,
change=-48%</li>
<li><b>ItalianFloods</b>: score=0.2, time=2020-01-04 11:25:17,
change=-43%</li>
<li><b>KoreanFood</b>: score=0.26, time=2020-01-04 11:25:21,
change=-100%</li>
</ul>
The second Template Renderer function receives with the same Python dictionary a Jinja2 template for rendering the data into a Markdown text. This document will then be sent through Mattermost.
Jinja2 template:
Events detected in tweets:{% for event in input1.events %}
\* \**{{event.useCase}}**: score={{event.score}},
time={{datetime.fromtimestamp(event.epoch_timestamp/1000.0).strftime('%Y-%m-%d
%H:%M:%S.%f')}}, change={{event.change}}{% endfor %}**
Generated Markdown text:
**Events detected in tweets:
\* \**EnglishFloods**: score=1.56, time=2020-01-04 11:24:53.565000,
change=91%
\* \**EnglishFood**: score=0.32, time=2020-01-04 11:24:57.885000,
change=-19
\* \**EnglishSnow**: score=0.58, time=2020-01-04 11:25:01.892000,
change=-34%
\* \**FinnishSnow**: score=0.43, time=2020-01-04 11:25:05.873000,
change=26%
\* \**GreekFloods**: score=0.94, time=2020-01-04 11:25:09.851000,
change=112%
\* \**GreekSnow**: score=0.23, time=2020-01-04 11:25:13.829000,
change=-48%
\* \**ItalianFloods**: score=0.2, time=2020-01-04 11:25:17.814000,
change=-43%
\* \**KoreanFood**: score=0.26, time=2020-01-04 11:25:21.795000,
change=-100%**
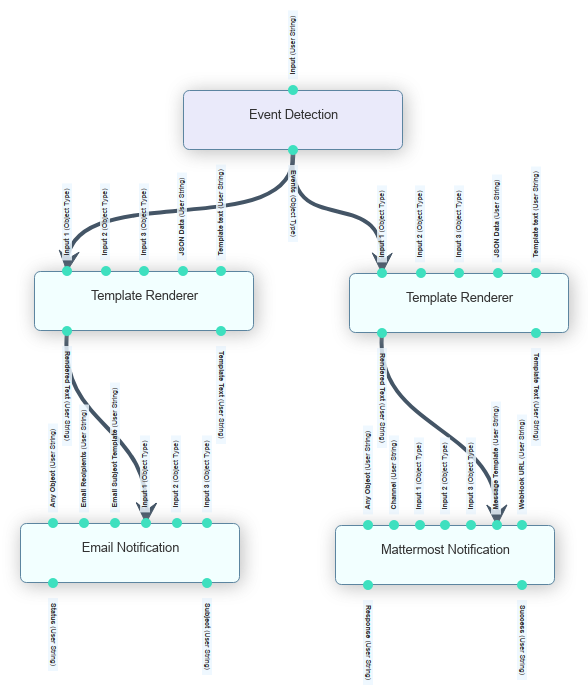
Figure 73 Event Detection Workflow using the Template Renderer
Generic Harvester
The generic Harvest process allows downloading files from a remote location to a local folder. The harvester supports the FTP and HTTP protocols. Files may be downloaded recursively and credentials may be provided to authenticate to remote FTP servers should it be necessary.
The input parameters that must be provided to the process are the following:
Source URL: FTP or HTTP URL where the data will be found.
Encrypted Credentials File: Should the FTP server require authentication to give access to the files, the FTP user credentials must be provided in an encrypted form to the process. This parameter receives the path to the file that contains the encrypted FTP user and password.
Local Path: The path to the folder where the downloaded files must be stored.
Glob Filter: Use this parameter to indicate which files must be downloaded by means of a glob string. If all the files must be downloaded, use the asterisk character “*”.
Recurse: Set to “True” if the files must be downloaded recursively.
The process outputs the following information:
New Files: JSON array containing the full list of downloaded files (with their path).
New Files Count: The amount of downloaded files (must match the size of the JSON array).
Status: “success”.
Workflow On‑Demand Execution
An immediate on‑demand Workflow execution may be requested from both the Workflows Management page (Figure 58) and in a specific Workflow Management page (Figure 60).
Both pages include a Configure Execution button. Clicking on it leads to the Workflow Parameterization page (Figure 74). This shows a form that allows entering or selecting the values to be provided to the workflow. The form content depends on the workflow definition and in particular the processes it includes and their unconnected input parameters.
Click on the Execute button located below the form to submit the order
and initiate the execution of the workflow. The Executions page (see
Workflow Execution Monitoring) is then automatically displayed. That
page is also reachable using the Executions tab located in the header
panel.
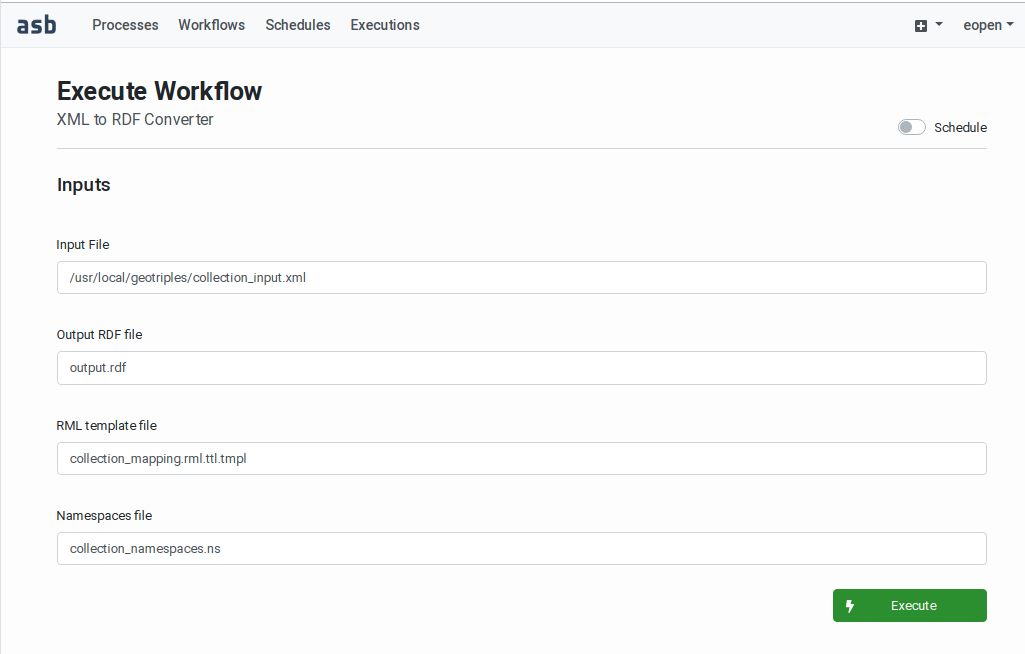
Figure 74 Workflow Parameterisation Page
Note: As can be seen on the figure above, a Schedule switch is provided above the parameterisation form. This allows revealing or hiding a second form for scheduling unattended executions (described in the next section). The same page thus allows initiating instant executions and configuring scheduled execution(s).
Workflow Executions Scheduling
The Workflow Execution Scheduling page is accessed either by clicking on a Schedule Executions button located on the Workflows Management page (see Figure 58) or in a specific Workflow Management page (Figure 60).
Scheduled execution allows to configure the date(s) and time(s) at which a given workflow must be executed. This allows, for example, executing a workflow a few hours after a given product is expected to become available, or each time the content of a database must be updated.
The available options are similar to what “cron” jobs allow in Linux/Unix systems:
Single execution at a given future date and time.
Repeated executions at a given time and interval (expressed in days), within a date range.
Repeated executions at a given time on specific month days. This allows, for example, executing a workflow at 1:00 AM every 1st, 11th and 21st day of each month.
In addition to the configuration of the scheduler itself, the Workflow Execution Scheduling page (as depicted on Figure 75) asks for the values to be given to the input parameters at each workflow execution.
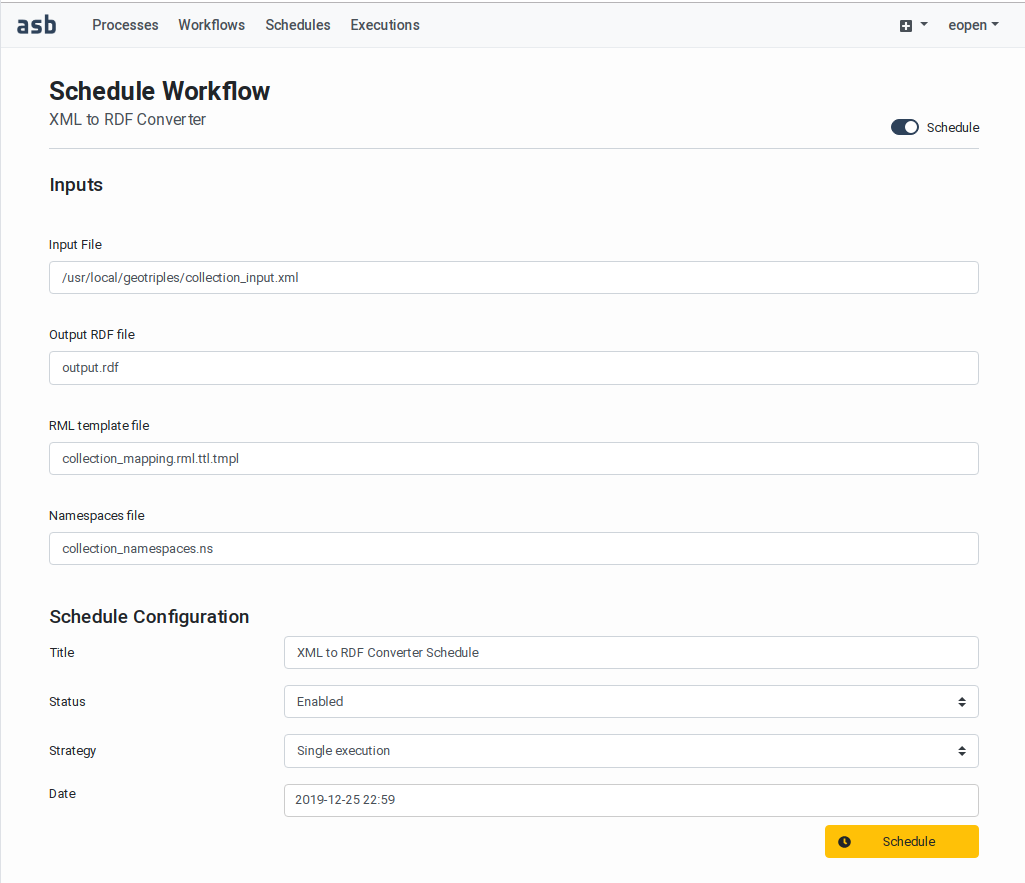
Figure 75 Workflow Execution Scheduling Page
As for on‑demand immediate executions, input parameters of the scheduled
workflows must be given static values. Variability is supported by
including in the workflow definition tasks that use static inputs to
produce context‑specific values at run time. This makes it possible, for
example, to output a date range that covers the 5 days that precede each
execution time. Read more about the Value Producers (Generators)
in Value Producers (Generators).
After initial configuration, the schedules are listed in the Schedules page (Figure 76), accessible using the Schedules tab located in the header panel. This page gives an overview of the existing schedules, being enabled or not. The table provides the following information:
a generated unique identifier,
the name given to the schedule entry (free text),
the workflow name and version,
the date and time the schedule entry has been created,
a verbalized version of the schedule configuration (schedule description),
a status flag (Enabled/Disabled)
Click on the schedule identifier to access to its Workflow Execution Scheduling page (Figure 75). This allows enabling/disabling and re‑configuring schedules individually.
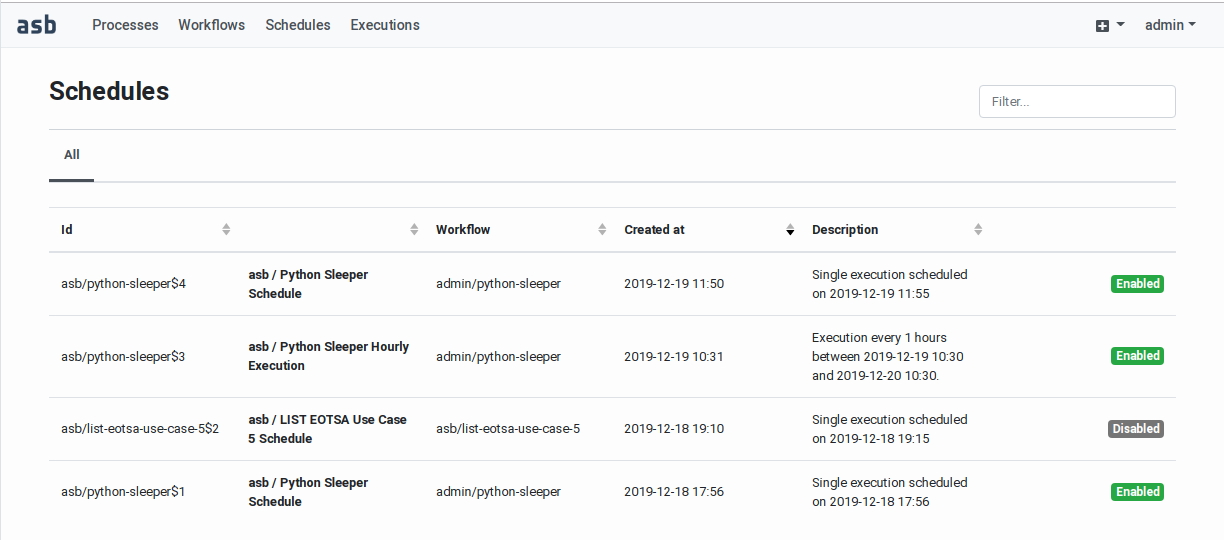
Figure 76 Workflow Execution Schedules Page
Workflow Execution Monitoring
Workflow executions may be monitored and inspected in the Workflow Executions page, accessible using the Executions tab located in the header panel.
The page displays all the workflow executions ever started in a workspace accessible by the current user (Figure 77). The executions table is paginated and shows by default the most recent and the on‑going executions. Above the table an input field allows filtering the table entries using a string fragment.
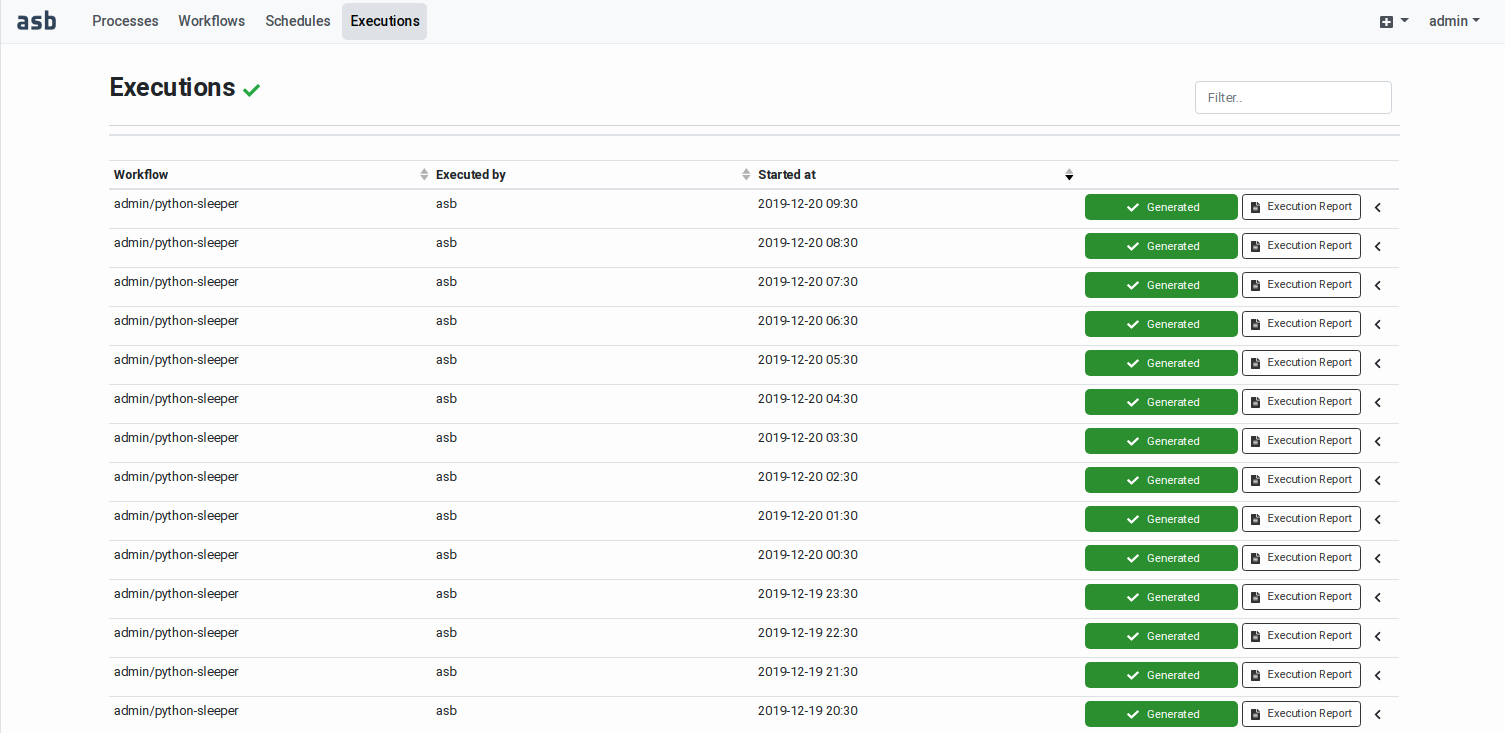
Figure 77 Workflow Executions Page
Each table row includes the following elements:
the identification of the executed (or being executed) workflow,
the user who initiated the (possibly scheduled) execution,
the date and time the particular execution has started,
the status of the workflow execution using a colour code: Pending (grey), Running (blue), Success (green), Failed (red). A percentage of completion is shown for on‑going executions.
an Execution Report button that leads to the Workflow Execution Report page (see
Workflow Execution Report),a caret < that allows revealing and hiding the workflow execution parameters right within the table (see Figure Figure 78)
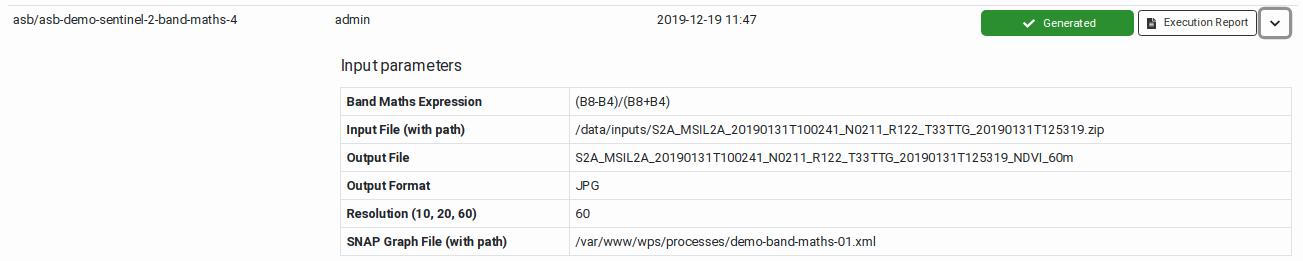
Figure 78 Workflow Execution Parameters
Workflow Execution Report
Access to the Workflow Execution Report pages is only available via the Workflow Executions page.
A Workflow Execution Report allows to inspect the execution metadata, the user-specified input parameters (bounding box, time range, scene identifiers, and other specific input values), the list of outputs and generated product files, and if available quicklooks of the output products. Figure 79 shows an example Workflow Execution Report.
At the top, the workflow execution metadata contain an EOPEN Datastore link (see the red box on the Figure) that points to the location where the files generated by the workflow have been collected. Clicking on that link opens the location in a new page (or tab depending on the browser configuration), as represented in Figure 80, below.
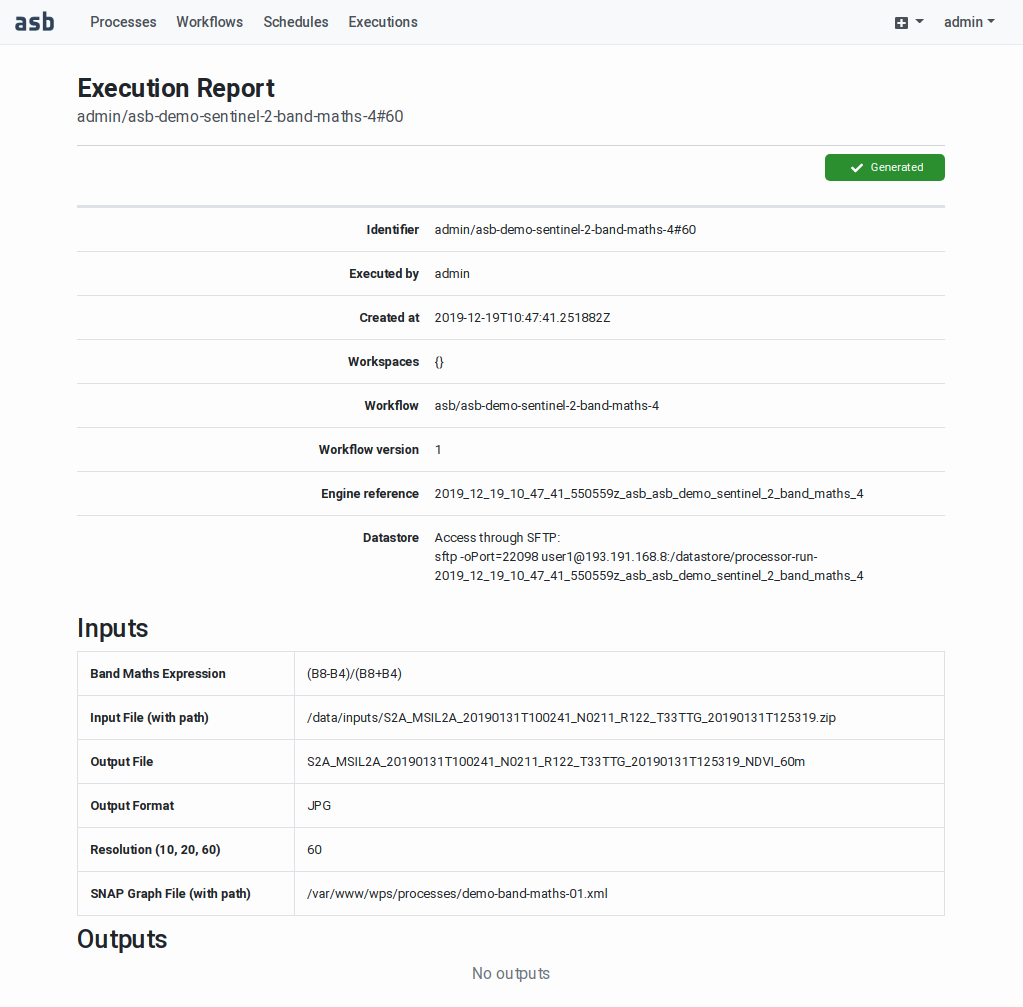
Figure 79 Workflow Execution Report
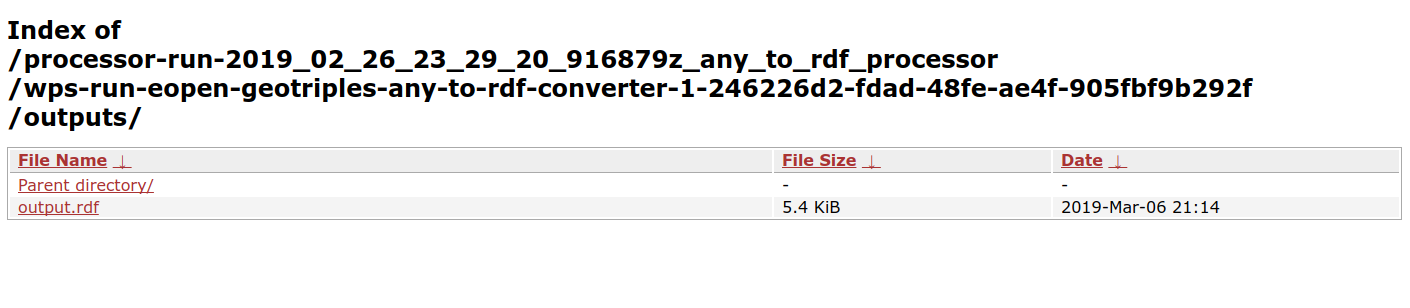
Figure 80 Workflow Run Output Folder in the Datastore
Workflow Sharing
By default, a Workflow is only visible and usable by its owner, that is, the user who created it.
In order to share a Workflow with other platform users, this must be added in a workspace accessible by these users (that is, a workspace in which they have a role).
In the following example, user “eopen” wants to share his Workflow “Example EOPEN Workflow” with the users who are given access to workspace “EOPEN”.
As can be seen on Figure 81, the process is not yet assigned to any workspace. To do this, click on the Share this workflow button. A popup dialog box appears. This allows selecting the workspace(s) the workflow must be assigned to. Workspaces must be selected in a drop‑down list. Once selected, a workspace may be removed by clicking on its “X” icon. The sequence of operations is depicted in Figure 82.
Figure 81 Workflow Management Page
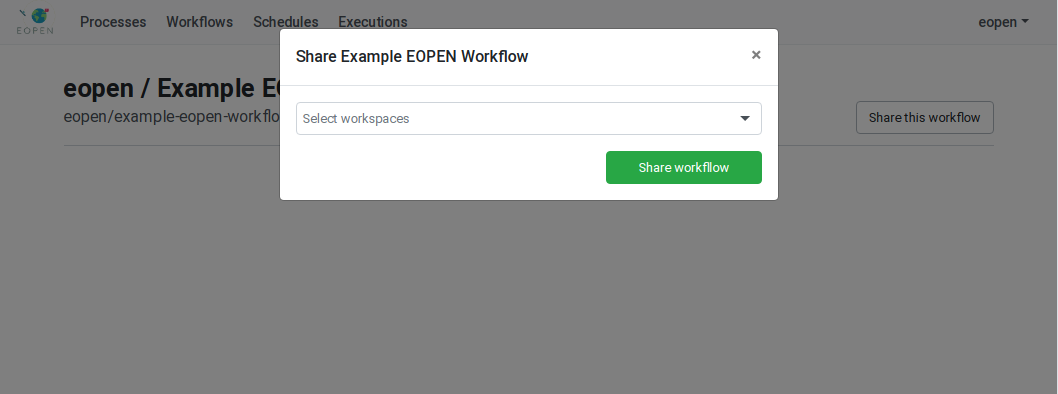
Figure 82 Workflow Sharing Operations
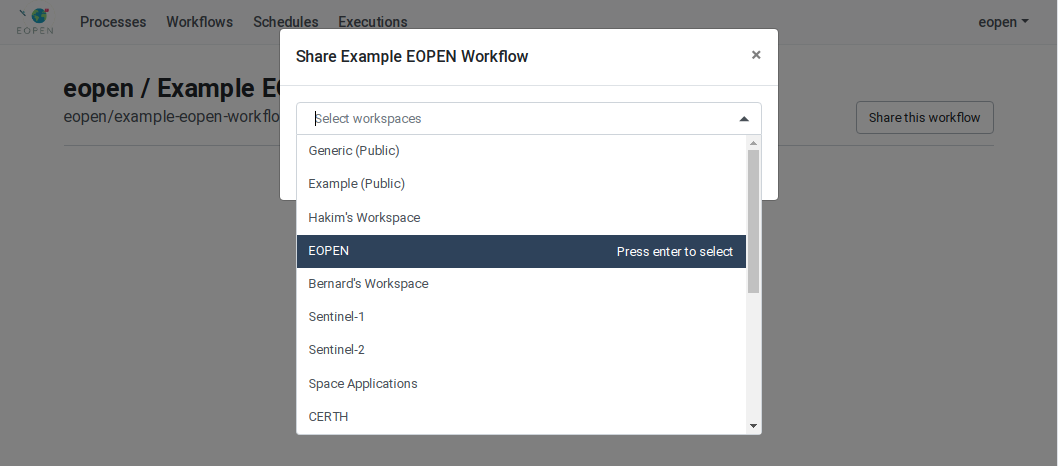
Figure 83 Workflow Sharing Operations
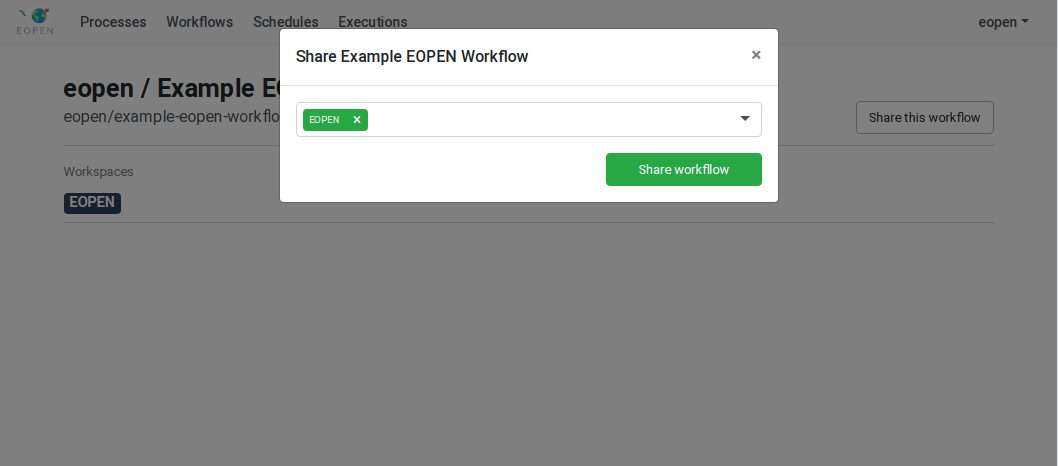
Figure 84 Workflow Sharing Operations
To cancel the changes, click on the “X” icon in the top‑right corner or simply click outside the dialog box. Click on the Share workflow button to apply the changes and close the box.
Glossary
In this section you will find the definition of the main concepts and technologies used in the EOPEN Platform.
Algorithm |
The code written by the developers and used to process data.
In the EOPEN Platform, files implementing the algorithms must be imported as processes as explained in |
|---|---|
Auxiliary Folder |
The Auxiliary folder (which may contain sub‑folders to organize the files) is meant to contain files consumed by the processes at execution time. The auxiliary folder is mounted in read‑only in the execution environment of each process instance to guarantee its immutability. Currently, the users may not populate the auxiliary folder themselves. Please contact the platform administrators (Space Applications Services) when files must be added or removed from the auxiliary folder. |
Community |
A community is a group of Twitter user accounts that are interconnected through the “mentioning” interaction. In the EOPEN platform, communities are visualised as network graphs, where nodes refer to users and links to mentioning connection. |
Concept |
Concepts cover a wide range of elements that can describe a Twitter image and are viewed next to collected images. They refer to objects (e.g. car, building), indoor/outdoor scenes or locations (e.g. road, river), scene elements (e.g. trees, clouds), and genre (e.g. weather). |
Controller Node |
The system that hosts the core components of the platform. For example, core components provide the following services: Web-based user interface Persistence of the configuration Workflow processes orchestration Cloud resources management User management In the context of the First EOPEN Prototype, the Controller Node is hosted at Space Applications Services. |
Datastore |
This is the storage volume where all the output files generated by the processes are persisted. Each Workflow Execution Report provides a link to the folder in the Datastore that contains the outputs of the executed processes.
See |
Docker/Dockerfile |
Docker is the technology used to build the execution environment (Docker image) of each individual process. In this environment, the tools and libraries necessary for running the process are pre‑installed. The software dependencies must be specified at import time (see |
Event |
An event is defined as a possible happening of importance in the real world that is expressed by unusual behaviour in the fluctuation of social media data, i.e. an irregular increase in the number of collected tweets. Users can be informed for potential events either by the platform’s notification system or by email. |
Key Player |
Key players are directly linked to communities and are usually nodes positioned in the centre of the community graphs. They refer to the most influential Twitter accounts, i.e. the most mentioned by other users. |
Owner (Process and Workflow) |
Each Process and Workflow existing in the platform is associated to one and only one Owner. By default, the owner is the user who has created a resource. Note: Changing an ownership cannot be done by the developers. It is under the responsibility of the platform administrators. |
Process |
A Process is a containerized algorithm. A Process definition includes a name, description, and version, as well as (typed) input and output parameters, and software and hardware dependencies. The typed inputs and outputs allow ensuring the compatibility of the parameters inter-connected in the workflow graphs. The EOPEN Developer Portal allows creating and configuring processes, uploading process (version) implementation files, and building and registering new process versions. In the EOPEN Platform, executing a process (as part of a Workflow) is a one‑shot operation. It is deployed, executed once, and then it is un‑deployed. |
Process Version |
A Process Version is a variant of a process that is implemented by a specific set of files. Multiple versions may be created for the same process for example to provide slightly different implementations, or to enhance the quality or the capabilities of the process implementation.
Once it is released, a Process Version may be selected and integrated in Workflows.
More about the Process and Process Version development lifecycle may be found in |
Process Wrapper |
In the EOPEN Platform context, a Process Wrapper is a script written in the Python language that acts as adapter for the imported algorithms. Algorithms require different sets of parameters and may potentially be implemented in various languages, compiled or not (e.g. Python, Java, R, C/C++). This has an impact on the manner an algorithm must be executed.
Concretely an “execute(…)” function must be implemented in each process wrapper to pass the input parameters to the algorithm and return back the results. The Process Import Tool must be used to generate process wrapper templates (see |
Public Folder Public Volume |
The Public Folder (or Volume) is meant to receive the files generated by the workflows and which must be available as input for other workflows (see |
Reliability |
Every displayed tweet comes with a reliability score, which is an automatic estimation of the probability (percentage) that the tweet shares real, and not fake information, based on characteristics of the user account and the tweet itself. |
Role |
A Role is a permission level that may be given to a platform User in a particular Workspace. A User may play several Roles in the same Workspace and may play different Roles in different Workspaces. Workspace and Roles determine the resources (Process, Workflow, Schedule, Report) a User may access and the actions he may execute on them. |
Sentinel-1 |
Sentinel-1 is the first of the five missions that ESA is developing for the Copernicus initiative. Its satellites operate day and night performing C-band synthetic aperture radar imaging, enabling them to acquire imagery regardless of the weather. |
Sentinel-2 |
Sentinel-2 is an Earth observation mission from the Copernicus Programme. Its satellites systematically acquire optical imagery at high spatial resolution (10 m to 60 m) over land and coastal waters. |
Service |
In the EOPEN Platform, a service may be seen as a persistent process. A service is deployed and started once. After that it remains active and is invoked by client processes. Example services are database engines (PostgreSQL/PostGIS, MongoDB), OGC web services (GeoServer) and Product Catalogues. They must be always available for use by client processes (orchestrated in workflows). The EOPEN Platform does not provide a user interface for importing, deploying and managing the orchestration (status, start, restart, stop) the services. These operations are performed manually by the platform administrators. Please contact them if necessary. |
Similarity Search |
Similarity search can be defined as the identification and retrieval of content similar to a query. The similarity may involve visual content if the query is an image, textual content if the query is a text (e.g. tweet message) or other types of information, i.e. time and location. In case the query includes multiple content (e.g., visual, textual, metadata), the similarity search considers all of the information. |
Topic |
A topic is a group of tweets that refer to a common subject and have been posted close in time. In the EOPEN platform, topics are visualised as a word clouds with the most mentioned keywords and clicking on a cloud shows all the tweets it comprises. |
Water Mask |
A water mask is an image or file that contains information about the water status of a specific area of interest, i.e. the discrimination between inundated and non-inundated regions. In the EOPEN platform, water masks can be visualised as layers in the GIS Viewer. |
WebHook |
A WebHook is a configurable HTTP end‑point in a running service. In the EOPEN Platform, Mattermost Incoming WebHooks are used to post instant messages. This feature is described in section . Supporting WebHooks in other software products is possible by implementing the appropriate client process. |
Worker Node |
A system that has been prepared for accepting process deployment and execution requests. Multiple processes may be run in parallel in a single worker node but running a variable amount of worker node provides better scalability. Worker nodes are typically created in cloud environments as they allow dynamically starting and stopping them depending on the demand. |
Workflow |
A Workflow is an Application defined by a graph of inter‑connected Processes. The EOPEN Developer Portal includes a graphical Workflow Editor (see |
Workspace |
A Workspace is a virtual environment which allows sharing resources, including Processes and Workflows, with other users.
On one hand individual Users may be given one or more Roles in certain Workspaces. On the other hand, each resource may below to selected Workspaces. The main rule is that a resource is accessible to a user only if he has a role in one of the resource workspaces. The role then determines what the user can do with the resource: View, Edit, Delete, etc.
Process and Workflow sharing is described in |
Inventory of the Integrated EOPEN Modules
This appendix provides an overview of the modules that have been integrated in the First EOPEN Prototype, either as processes or as services.
Integrated Processes
Process |
Search Hubs 2 |
Description |
Search Sentinel data hubs for S1, S2 and S3 metadata. Store the metadata in the Sentinel Product Catalogue. |
Provider |
NOA |
Reference |
Umbrella Application of Sentinel Hubs, KR10 (NOA, Task 3.1, M1‑M32, D3.1) |
Process |
Scoring Hubs v1 |
Description |
Measure Download Speed of Hubs and update the Product Catalogue. |
Provider |
NOA |
Reference |
Umbrella Application of Sentinel Hubs, KR10 (NOA, Task 3.1, M1‑M32, D3.1) |
Process |
Delete Metadata v1 |
Description |
Delete from the Product Catalogue the products that no longer exist in the Sentinel hubs |
Provider |
NOA |
Reference |
Umbrella Application of Sentinel Hubs, KR10 (NOA, Task 3.1, M1‑M32, D3.1) |
Process |
Discovery Process v1 |
Description |
Discover Sentinel-1 and Sentinel-2 products using the NOA umbrella API. |
Provider |
CERTH |
Reference |
Change Detection in EO Data, KR01 (CERTH, Task 4.1, M1‑M33, D4.4) |
Process |
Download Product v1 |
Description |
Download a list of Sentinel-1 and Sentinel-2 products. |
Provider |
CERTH |
Reference |
Change Detection in EO Data, KR01 (CERTH, Task 4.1, M1‑M33, D4.4) |
Process |
Sentinel-1 Waterbodies Generation v5 |
Description |
Create water bodies and processed images based on selected VV or VH band. Receive as inputs a list with multiple product filenames, an AOI polygon and optionally the desired bands to process (VV is default). Store information about the processed products in MongoDB. |
Provider |
CERTH |
Reference |
Change Detection in EO Data, KR01 (CERTH, Task 4.1, M1‑M33, D4.1) |
Process |
Sentinel-2 Watermask Generation v2 |
Description |
Receive a list of Sentinel‑2 products as input, generate a water mask for each scene, and store the results in MongoDB. |
Provider |
CERTH |
Reference |
Change Detection in EO Data, KR01 (CERTH, Task 4.1, M1‑M33, D4.1) |
Process |
Event Detection v1 |
Description |
Detect peaks in the daily number of tweets over a month. |
Provider |
CERTH |
Reference |
Event Detection Module, KR02 (CERTH, Task 4.2, M3-M32, D4.4) |
Process |
GeoTriples Any to RDF Converter v1 |
Description |
Use GeoTriples to convert structured data into RDF. |
Provider |
SpaceApps |
Reference |
Linked open EO data, KR09 (SpaceApps, Task 5.2, M7-M33, D5.3) |
Process |
Publish on GeoServer |
Description |
Publish a GeoTIFF or a Shapefile product as a GIS layer in GeoServer. |
Provider |
SpaceApps |
Reference |
EOPEN System Integration (SpaceApps, Task 6.2, M5‑M33, D6.3) |
Process |
Mattermost Notification |
Description |
Send a notification to a
Mattermost channel. See
|
Provider |
SpaceApps |
Reference |
EOPEN System Integration (SpaceApps, Task 6.2, M5‑M33, D6.3) |
Process |
Harvester v2 |
Description |
Copy files from a (possibly
remote) location to a local
folder. See
|
Provider |
SpaceApps |
Reference |
EOPEN System Integration (SpaceApps, Task 6.2, M5‑M33, D6.3) |
Process |
Store in Strabon |
Description |
Import an RDF graph stored in a file into a Strabon triplestore. |
Provider |
SpaceApps |
Reference |
Linked open EO data, KR09 (SpaceApps, Task 5.2, M7-M33, D5.3) |
Process |
Query Strabon |
Description |
Search for linked data in a Strabon triplestore using a SPARQL query. Depending on the SPARQL query, stores SPARQL results (after a SELECT) or an RDF graph (after a CONSTRUCT) in a file. |
Provider |
SpaceApps |
Reference |
Linked open EO data, KR09 (SpaceApps, Task 5.2, M7-M33, D5.3) |
Process |
Query MongoDB |
Description |
Search for linked data in a MongoDB triplestore using a SPARQL query. |
Provider |
SpaceApps |
Reference |
Linked open EO data, KR09 (SpaceApps, Task 5.2, M7-M33, D5.3) |
Process |
Query RDF File |
Description |
Search for linked data in an RDF graph stored in a file using a SPARQL SELECT query. Stores the SPARQL results in a file in JSON or XML format. |
Provider |
SpaceApps |
Reference |
Linked open EO data, KR09 (SpaceApps, Task 5.2, M7-M33, D5.3) |
Process |
RDF Merger |
Description |
Merge up to five RDF graphs stored in individual files and outputs the result in a file. |
Provider |
SpaceApps |
Reference |
Linked open EO data, KR09 (SpaceApps, Task 5.2, M7-M33, D5.3) |
Integrated Services
The services listed here are used by the processes introduced above when they are executed within workflows.
Service |
Mattermost |
Description |
Mattermost, the messaging and notification service. |
Provider |
SpaceApps |
Reference |
EOPEN System Integration (SpaceApps, Task 6.2, M5‑M33, D6.3) |
Service |
eopen-communities |
Description |
Detect communities in Twitter records and return the results in JSON format. |
Provider |
CERTH |
Reference |
Community Detection Module, KR07 (CERTH, Task 4.5, M5-M33, D4.4) |
Service |
eopen-clustering |
Description |
Apply a clustering mechanism to perform topic detection in Twitter records and return the results in JSON format. |
Provider |
CERTH |
Reference |
Data Clustering Module, KR05 (CERTH, Task 4.4, M1-M36, D4.2) |
Service |
twitter-web |
Description |
Convert analysis results formatted in JSON into RDF formatted in Turtle (TTL) and use the GraphDB service to store the result. |
Provider |
CERTH |
Reference |
Reasoning for Decision Support, KR08 (CERTH, Task 5.3, M6‑M32, D5.1) |
Service |
Semantic Mapping Service |
Description |
Receive data (single tweets, topics, events, flood maps) in JSON format, transform into semantic format (RDF) and save the results into a Knowledge Base |
Provider |
CERTH |
Reference |
Knowledge Management, KR08 (CERTH, Task 5.2, M6‑M32, D5.1) |
Service |
Retrieve Linked Data Service |
Description |
Receive an AOI and TOI as inputs, search for corresponding entities search for corresponding entities (single tweets, events, floop maps) in GraphDB using SPARQL/GeoSPARQL queries and return the result in GeoJSON format |
Provider |
CERTH |
Reference |
Knowledge Management, KR08 (CERTH, Task 5.3, M6‑M32, D5.1) |
Service |
Umbrella Application of Sentinel Hubs |
Description |
Implement a Product Catalogue that contains the metadata of the Sentinel missions. The data is stored in PostgreSQL/PostGIS. |
Provider |
NOA |
Reference |
Umbrella Application of Sentinel Hubs, KR10 (NOA, Task 3.1, M1‑M32, D3.1) |
Service |
GraphDB |
Description |
Store the Linked Data generated by CERTH’s JSON to RDF converter |
Provider |
CERTH |
Reference |
Knowledge Management, KR08 (CERTH, Task 5.3, M6‑M32, D5.1) |
Service |
Strabon |
Description |
Store the Linked EO data generated by SpaceApps’ JSON to RDF converter |
Provider |
SpaceApps |
Reference |
Knowledge Management, KR08 (SpaceApps, Task 5.2, M7‑M33, D5.2) |
Service |
MongoDB |
Description |
Store data about the collected tweets and the analysed EO products |
Provider |
CERTH |
Reference |
Social Media Crawlers, KR12 (CERTH, Task 3.2, M1-31, D3.3) |
Service |
PostgreSQL / PostGIS |
Description |
Stores the Product Catalogue (Umbrella Application of Sentinel Hubs) data. |
Provider |
SpaceApps |
Reference |
n/a |
Service |
GeoServer |
Description |
Organize and serve the geo‑temporal data stored or generated by EOPEN using OGC standards (incl. WMS, WFS). |
Provider |
SpaceApps |
Reference |
Interactive real-time visualisations (SpaceApps, Task 6.4, M7-M33, D6.5) |
SNAP Graph Parameterisation
SNAP graphs edited and exported using the SNAP Graph Builder, built in the SNAP Desktop application only contain hard‑coded parameters. In order to execute such a graph using SNAP Graph Processing Tool (GPT) and giving the possibility to specify parameter values at execution time, it is necessary to adapt the graph by replacing hard‑coded values with named placeholders.
Some SNAP operators also omit to specify input parameters because they are expected to be provided by the user when the graph is executed using the SNAP Desktop application. In such a case, the missing parameters must be added with named placeholders.
The graph fragment shown below includes example operators with omitted (in the “Read” operator) and hard‑coded parameters (in the “Write” operator).
 <graph id="Graph">
   <version>1.0</version>
   <node id="Read">
     <operator>Read</operator>
     <sources/>
     <parameters class="com.bc.ceres.binding.dom.XppDomElement"/>
     <!-- "file" parameter is missing here -->
   </node>
   <!-- elements removed here -->
   <node id="Write">
     <operator>Write</operator>
     <sources>
       <sourceProduct refid="Convert-Datatype"/>
     </sources>
     <parameters class="com.bc.ceres.binding.dom.XppDomElement">
       <!-- Hard-coded file name below -->
       <file>L:\S1_SMCampaign\Output\target.tif</file>
       <formatName>GeoTIFF-BigTIFF</formatName>
     </parameters>
   </node>
   <applicationData id="Presentation">
   </applicationData>
 </graph>
The next graph fragment shows the same SNAP graph fragment in which the omitted and the hard‑coded parameters have been replaced with named placeholders:
 <graph id="Graph">
   <version>1.0</version>
   <node id="Read">
     <operator>Read</operator>
     <sources/>
     <parameters class="com.bc.ceres.binding.dom.XppDomElement">
       <file>${scene1}</file>
     </parameters>
   </node>
   <!-- elements removed here -->
   <node id="Write">
     <operator>Write</operator>
     <sources>
       <sourceProduct refid="Convert-Datatype"/>
     </sources>
     <parameters class="com.bc.ceres.binding.dom.XppDomElement">
       <file>${outputTiff}</file>
       <formatName>GeoTIFF-BigTIFF</formatName>
     </parameters>
   </node>
   <applicationData id="Presentation">
   </applicationData>
 </graph>
To execute the parameterized SNAP graph using GPT, a value must be provided to fill‑in each placeholder using the syntax “-P{name}={value}”. To be on the safe side, it is advised to enclose the value within double quotes.
Example GPT call:
/snap/bin/gpt "snap_gaph.xml" \
   -PoutputTiff="target.tif" \
   -Pscene1="S1B_S3_SLC__1SDV_20180201T173939_20180201T174013_009433_010F43_29FE.zip"
Example process_wrapper.py scripts
Execution of a SNAP Graph using GPT
The following code gives an example of process wrapper function that executes the command‑line SNAP GPT (Graph Processing Tool) on a parameterized SNAP Graph whose name is provided in parameter.
The code on white background is automatically produced by the Process
Wrapper Template Generator (see Generation of a Process Wrapper Script).
The custom instructions added into the
template are highlighted in the pink areas. The execute function
generates the “gpt” execution string using the values received in
the input parameters then executes it in a sub‑process using the Python
subprocess library. The function returns the path to the output
file.
import datetime, os, subprocess

# --------------------------------------------------------------------------------------
# Save this code in file "process_wrapper.py" and adapt as indicated in inline comments.
#
# Notes:
#  - This is a Python 3 script. It is incompatible with Python 2.
#  - The inputs will be given values by name, thus their order has no importance ...
#  - ... except that the inputs with a default value must be listed last.
#  - Parameter names are automatically converted into valid Python variable names.
#  - Any empty line or line starting with a '#' character will be ignored.
# --------------------------------------------------------------------------------------
SNAP_HOME='/home/worker/snap/'
JAVA_HOME='/usr/local/jre'
JRE_HOME='/usr/local/jre'
def log_info(out_dir, message):
    with open(os.path.join(out_dir, 'stdout.txt'), 'a') as out_file:
        out_file.write('[%s]\n%s\n' % (datetime.datetime.today(), message))

def log_error(out_dir, message):
    with open(os.path.join(out_dir, 'stderr.txt'), 'a') as out_file:
        out_file.write('[%s]\n%s\n' % (datetime.datetime.today(), message))

def execute(out_dir, snap_graph_file, input_file, resolution, band_maths_expression, \
            output_file, output_format):
    """
    Identification:
    Name -- ASB Demo Sentinel-2 Band Maths
    Description --
    Version -- 1
    Author --
    Mission -- sentinel_2

    Inputs:
    snap_graph_file -- SNAP Graph File (with path) -- 45/User String
    input_file -- Input File (with path) -- 45/User String
    resolution -- Resolution (10, 20, 60) -- 45/User String
    band_maths_expression -- Band Maths Expression -- 45/User String
    output_file -- Output File -- 45/User String
    output_format -- Output Format -- 45/User String

    Outputs:
    output_path -- Output Path -- 45/User String

    Main Dependency:
    snap_sen_tbx-7.0

    Software Dependencies:
    python-2

    Processing Resources:
    ram -- 8
    disk -- 100
    cpu -- 4
    """

    output_path = None

    # ----------------------------------------------------------------------------------
    # Insert your own code below.
    # Store the generated files in the "out_dir" folder. Anything else is dropped after
    # each process execution.
    # Give appropriate values to the ouput parameters. These will be passed to the next
    # process(es) following the worklow connections.
    # ----------------------------------------------------------------------------------

    proc = None
    output_file = os.path.join(out_dir, os.path.split(output_file_name)[1])
    # Add '-e' parameter to get more stack traces in case of error
    cmd = ('gpt "%s" -c 16G -q 8 -e -Pinput_file="%s" -Pband_maths_expression="%s" ' \
           '-Pname="%s" -Ptype="%s" -Poutput_file="%s" -Poutput_format="%s"') % \
          (snap_graph_file, input_file, band_maths_expression, name, type, \
           output_file_name, output_format)

    log_info(out_dir, 'Command: \n%s\n' % cmd)

    try:
        proc = subprocess.Popen([cmd], stderr=subprocess.PIPE, shell=True)
        (out, err) = proc.communicate()

        log_info(out_dir, out)
        log_error(out_dir, err)

    except Exception as e:
        if not proc:
            raise Exception('Exception while preparing gpt execution: %s' % e)
        log_info(out_dir, 'Process return code: %s' % proc.returncode)
        raise Exception('Exception during gpt execution: %s' % e)

    # ----------------------------------------------------------------------------------
    # The wrapper must return a dictionary that contains the output parameter values.
    # ----------------------------------------------------------------------------------

    return {
        'output_path': output_file
    }
Execution of GeoTriples using JRE
The following code gives an example of process wrapper function that executes the GeoTriples application in headless mode. GeoTriples is used to convert structured data (including JSON, XML, and Shapefile) into RDF. It receives as inputs the name of the input and output files, as well as the name of the files that contain the mapping rules and the applicable RDF namespaces.
import datetime, os, subprocess

# --------------------------------------------------------------------------------------
# Save this code in file "process_wrapper.py" and adapt as indicated in inline comments.
#
# Notes:
#  - This is a Python 3 script. It is incompatible with Python 2.
#  - The inputs will be given values by name, thus their order has no importance ...
#  - ... except that the inputs with a default value must be listed last.
#  - Parameter names are automatically converted into valid Python variable names.
#  - Any empty line or line starting with a '#' character will be ignored.
# --------------------------------------------------------------------------------------
JRE_BIN='/usr/local/jre/bin/java'
JAVA_HOME='/usr/local/jre'
JRE_HOME='/usr/local/jre'
JRE_BIN='/usr/local/jre/bin/java'
GEOTRIPLES_HOME='/usr/local/geotriples'

def execute(out_dir, input_file='', rml_template_file='mapping.rml.ttl.tmpl', \
            output_rdf_file='output.rdf', namespaces_file='namespaces.ns'):
    """
    Identification:
    Name -- GeoTriples Any to RDF Converter
    Description -- Use GeoTriples to convert structured data into RDF
    Version -- 1
    Author --
    Mission -- eopen

    Inputs:
    input_file -- Input file -- 45/User String
    rml_template_file -- RML template file -- 45/User String -- mapping.rml.ttl.tmpl
    namespaces_file -- Namespaces definition file -- 45/User String -- namespaces.ns
    output_rdf_file -- Output RDF file -- 45/User String -- output.rdf

    Outputs:
    status -- Status -- 45/User String
    output_file -- Output file -- 45/User String

    Main Dependency:
    python-2

    Software Dependencies:
    python-2
    oracle_jre-8u171
    geotriples-1.1.6

    Processing Resources:
    ram -- 2
    disk -- 10
    cpu -- 1
    """

    output_path = None

    # ----------------------------------------------------------------------------------
    # Insert your own code below.
    # Store the generated files in the "out_dir" folder. Anything else is dropped after
    # each process execution.
    # Give appropriate values to the ouput parameters. These will be passed to the next
    # process(es) following the worklow connections.
    # ----------------------------------------------------------------------------------

    jre = JRE_BIN
    jar = os.path.join(GEOTRIPLES_HOME, 'geotriples-1.1.6-SNAPSHOT-cmd.jar')
    cmd = 'dump_rdf'
    output_file = os.path.join(out_dir, output_rdf_file)

    # Render the RML template file into an RML mapping file
    # That is, replace the placeholders ${input_file} with the value of intput_file
    rml_mapping_file = '/tmp/mapping.rml.ttl'
    rml_template_file_in = open(rml_template_file, 'r')
    rml_mapping_file_out = open(rml_mapping_file, 'w')
    for line in rml_template_file_in:
        rml_mapping_file_out.write(line.replace('${input_file}', input_file))
    rml_template_file_in.close()
    rml_mapping_file_out.close()

    log4j = '-Dlog4j.configuration=file://'+GEOTRIPLES_HOME+'/log4j.properties'

    try:
        # java -jar ../../target/geotriples-1.0.5-SNAPSHOT-cmd.jar dump_rdf
        #      -ns namespaces.ns -s 31370 -rml -o output.rdf  mapping.rml.ttl
        cmd_str = "%s %s -jar '%s' %s -ns '%s' -s 31370 -rml -o '%s' '%s'" % \
                  (jre, log4j, jar, cmd, namespaces_file, output_file, rml_mapping_file)
        print(cmd_str)
        status = subprocess.Popen(cmd_str, shell=True, \
                                  stdout=subprocess.PIPE).stdout.read()
    except Exception as e:
        status = 'Failed with exception: %s' % str(e)

    # ----------------------------------------------------------------------------------
    # The wrapper must return a dictionary that contains the output parameter values.
    # ----------------------------------------------------------------------------------

    return {
        'status': status,
        'output_file': output_file
    }
Execution of local shell scripts
The following code gives an example of process wrapper function that executes a local shell script whose name is provided in the “script” input parameter. Other input values are passed to the Bash script as well.
This particular example is used to execute a process pre-deployed at HLRS, get back the output of the process (showresult), as well as retrieve the input text (showinput). This last step is included for testing purpose.
# --------------------------------------------------------------------------------------
# Save this code in file "process_wrapper.py" and adapt as indicated in inline comments.
#
# Notes:
#  - This is a Python 3 script. It is incompatible with Python 2.
#  - The inputs will be given values by name, thus their order has no importance ...
#  - ... except that the inputs with a default value must be listed last.
#  - Parameter names are automatically converted into valid Python variable names.
#  - Any empty line or line starting with a '#' character will be ignored.
# --------------------------------------------------------------------------------------

def execute(out_dir, script, username, key, input_file, output_file):
    """
    Identification:
    Name -- EOPEN HLRS SSH Integration
    Description -- Proof-of-concept for EOPEN HLRS Integration. Running a SPARK example through ssh. Implemented for 16/11/2018 review.
    Version -- 1
    Author -- Space Applications Services
    Mission -- eopen

    Inputs:
    script -- Script -- 45/User String
    username -- Username -- 45/User String
    key -- Key -- 45/User String
    input_file -- Input File -- 45/User String
    output_file -- Output File -- 45/User String

    Outputs:
    input_content -- Input content -- 45/User String
    result -- Result -- 45/User String
    logs -- Logs -- 45/User String

    Main Dependency:
    python-2

    Processing Resources:
    ram -- 1
    disk -- 1
    cpu -- 1

    """
    input_content = None
    result = None
    logs = None

    # ----------------------------------------------------------------------------------
    # Insert your own code below.
    # Store the generated files in the "out_dir" folder. Anything else is dropped after
    # each process execution.
    # Give appropriate values to the ouput parameters. These will be passed to the next
    # process(es) following the worklow connections.
    # ----------------------------------------------------------------------------------

    import subprocess
    proc = subprocess.Popen(
               ['bash', script, 'execute', username, key, input_file, output_file],
               stdout=subprocess.PIPE, stderr=subprocess.STDOUT)
    logs = proc.stdout.read()
    proc = subprocess.Popen(
               ['bash', script, 'showresult', username, key, input_file, output_file],
               stdout=subprocess.PIPE, stderr=subprocess.STDOUT)
    result = proc.stdout.read()
    proc = subprocess.Popen(
               ['bash', script, 'showinput', username, key, input_file, output_file],
               stdout=subprocess.PIPE, stderr=subprocess.STDOUT)
    input_content = proc.stdout.read()

    # ----------------------------------------------------------------------------------
    # The wrapper must return a dictionary that contains the output parameter values.
    # ----------------------------------------------------------------------------------

    return {
        'input_content': input_content,
        'result': result,
        'logs': '<![CDATA[' + logs + ']]>',
    }
Social Media (Tweets) Viewer
The pre-defined Social Media page allows searching and inspecting the available tweets. It is accessed through the entry of the same name in the Dashboards menu.
Figure 12 Social Media
As can be seen on Figure 12, the “Social Media” dashboard integrates a form on the left, a list of tweets in the centre, and a map on the right.
Tweets Filtering
Use the form to filter the tweets:
Select one of the implemented use cases: Flood Events, Snow Cover, and Food Security.
Then select a language, the relevant options (only tweets with images, only original tweets, etc.), and a date range. By default the date range ends on the current day.
Optionally, enter a word or a word fragment in the “Find word in tweet …” field.
Then click on the Search button.
The tweets matching the search criteria are displayed in the centre. This list is paginated: by default, each page contains 50 entries. Controls located above the list allow moving to the previous and next page, and moving back to the first page. The number of the current page is also displayed. A menu allows changing the amount of entries in a page, between 50 and 500 with steps of 50 entries.
Tweets Information
Each tweet in the list is displayed with the text, an “anonymised” version of the author, and the creation timestamp.
When a tweet contains an image, a reduced version of it is displayed in the list. Click on a thumbnail image to obtain a bigger version.
The EOPEN Platform also integrates a location extraction service, which applies to the text, and a concept extraction service which applies on the images.
Extracted locations are displayed by means of a clickable link. When clicked, the interactive map, on the right, is automatically re‑focused on the selected tweets.
Note: When the “Show tweets on map” switch is activated, all the geo‑localised tweets are automatically displayed on the map by means of point markers. Click on a marker to reveal the tweet text on the map (as shown on Figure 12).
Concepts are extracted from images. These are displayed within “badges”. Currently, these badges are not active. In a future version of the component, the badges will be clickable and will allow filtering the tweets based on selected concepts.